
Losh, S; Walter, L; Meulbroek, P; Martini, A; Cathles, L; Whelan, J., 2002, AAPG Bulletin v. 86, no. 8: 1463-1488
Brine and oil chemistry: flow direction indicators
Reservoir fluids at the SEI330 field, about 150 km offshore Louisiana in Pleistocene deltaic sands, preserve evidence of their source as well as their migration history. The reservoirs are in Plio-Pleistocene sands at temperatures less than 80 C. The brines, however, are high in iodine, indicative of interaction with organic matter that has undergone catagenesis. This iodine yields 129I/I ages of 31 to 59 Ma, consistent with brine origin in sediments of Oligocene to Paleocene age at the youngest. Brine 87Sr/86Sr ratios are consistent with source in sediment of at least Oligocene age. The brines are highly saline, up to 16.5% TDS, and at the same time have seawater Br concentrations, indicative of halite dissolution along their flowpath. The bulk and isotopic chemistry indicates the SEI330 brines migrated several kilometers vertically into the reservoirs.
The brines show a pronounced deficiency in sodium relative to chloride in excess of seawater concentrations when compared to a 1:1 molar ratio that would be expected from halite dissolution. As shown in Figure 1, this ‘sodium deficiency’ is correlated with the abundance of other soluble cations (K+, Ca++, Mg++, and the like). The nearly 1:1 correlation suggests cation exchange reaction between brine and sediment through which the brine flowed.
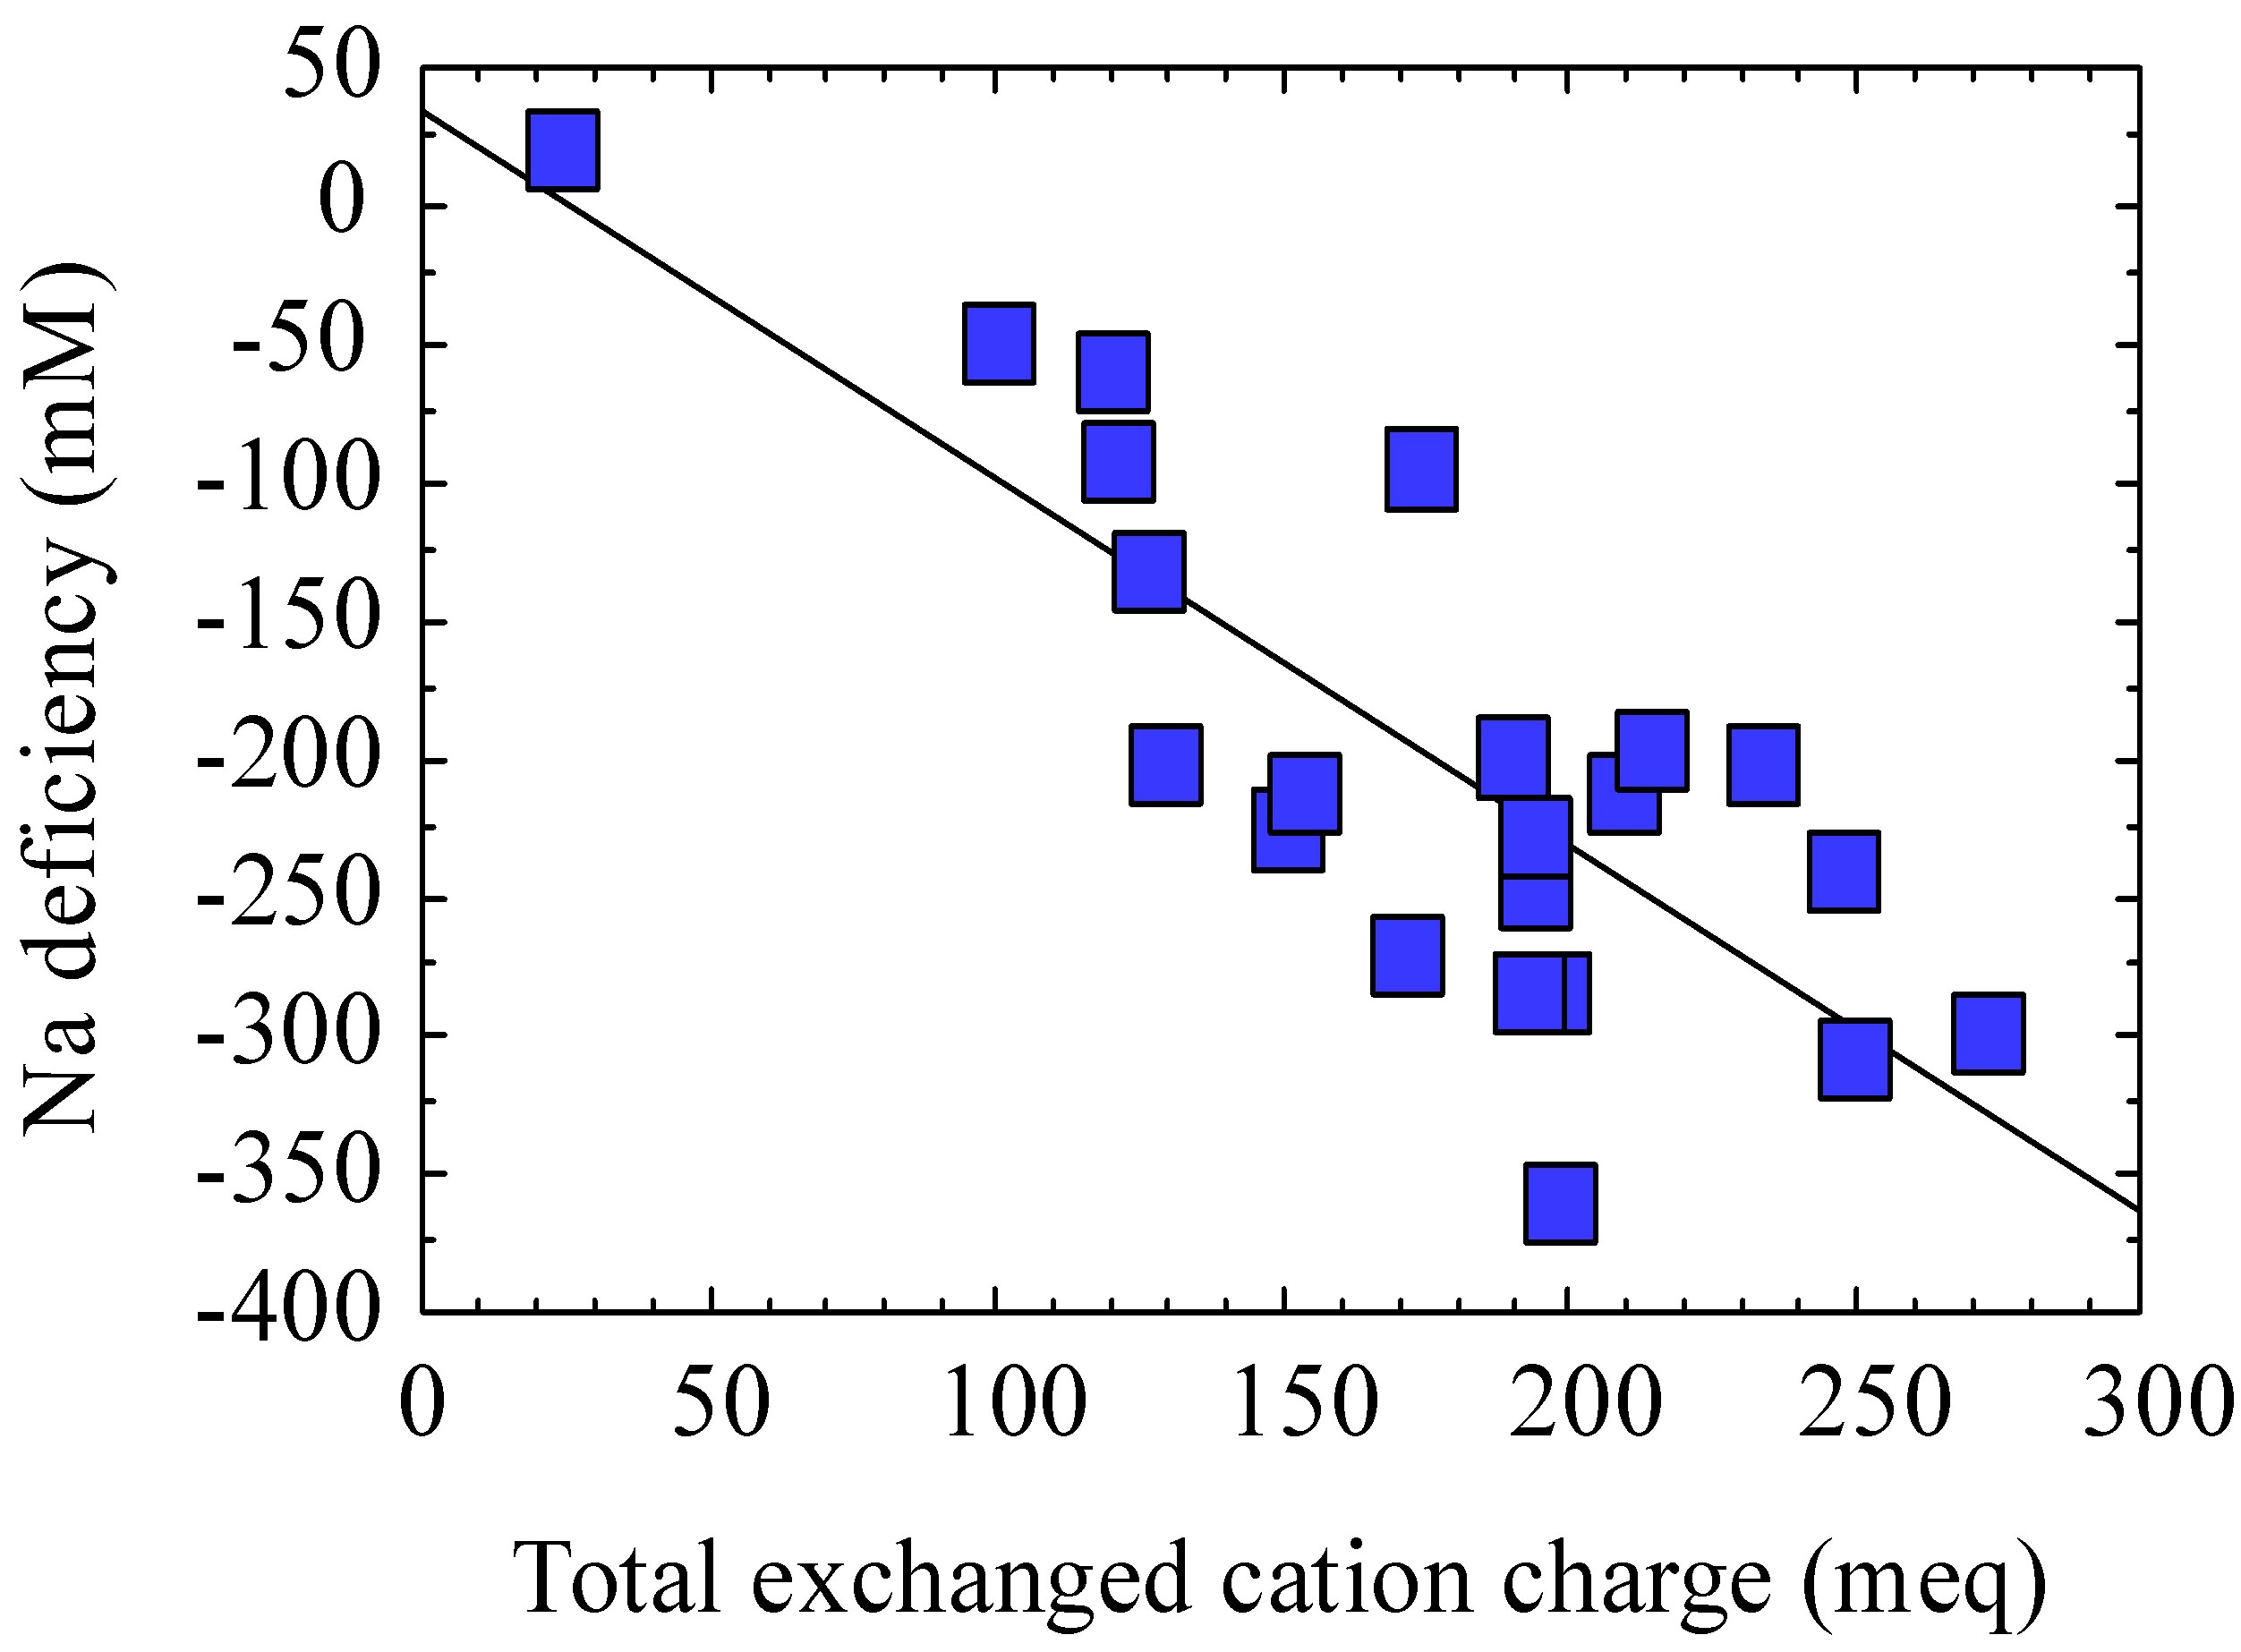
Figure 1. Sodium deficiency versus total exchanged cation charge (K+, Ca++, Mg++, Ba++, and Sr++), in milliequivalents. The “zero Na deficiency” value for each cation is taken as the cation concentration apart from sodium exchange. These values were subtracted from each measurement to determine the exchanged cation charge, according to the equation: cation meq = 2((Ca-30)+(Mg-20)+(Sr-0.1) + (Ba-0.2)) + (K-2.2), where the cations are in mM.
Brine sodium deficiency shows a consistent trend across the two reservoirs, the HB and the GA, that contained enough datapoints to evaluate spatial trends. The more sediment the brine flowed past, the more of its sodium was exchanged with cations derived from sediment. Sodium deficiency increases to the north in these sands (Figure 2), consistent with cation exchange between brine and sediment during flow to the north. The sodium deficiency pattern is mirrored in the brine iodine concentrations, which decrease northward across the reservoirs. This northward decrease in iodine concentration may track mixing of iodine-rich, deep-sourced brine with iodine-poor, connate fluids in the GA and HB sands, again pointing to influx of the ascending brines from the south. Brine 87Sr/86Sr roughly correlates with sodium deficiency: the greater the sodium exchange, the more radiogenic the Sr isotope ratio. These brines have migrated from the direction of a minibasin-bounding growth fault south of the reservoirs, not from the ‘A’ Fault shown in Figure 2.
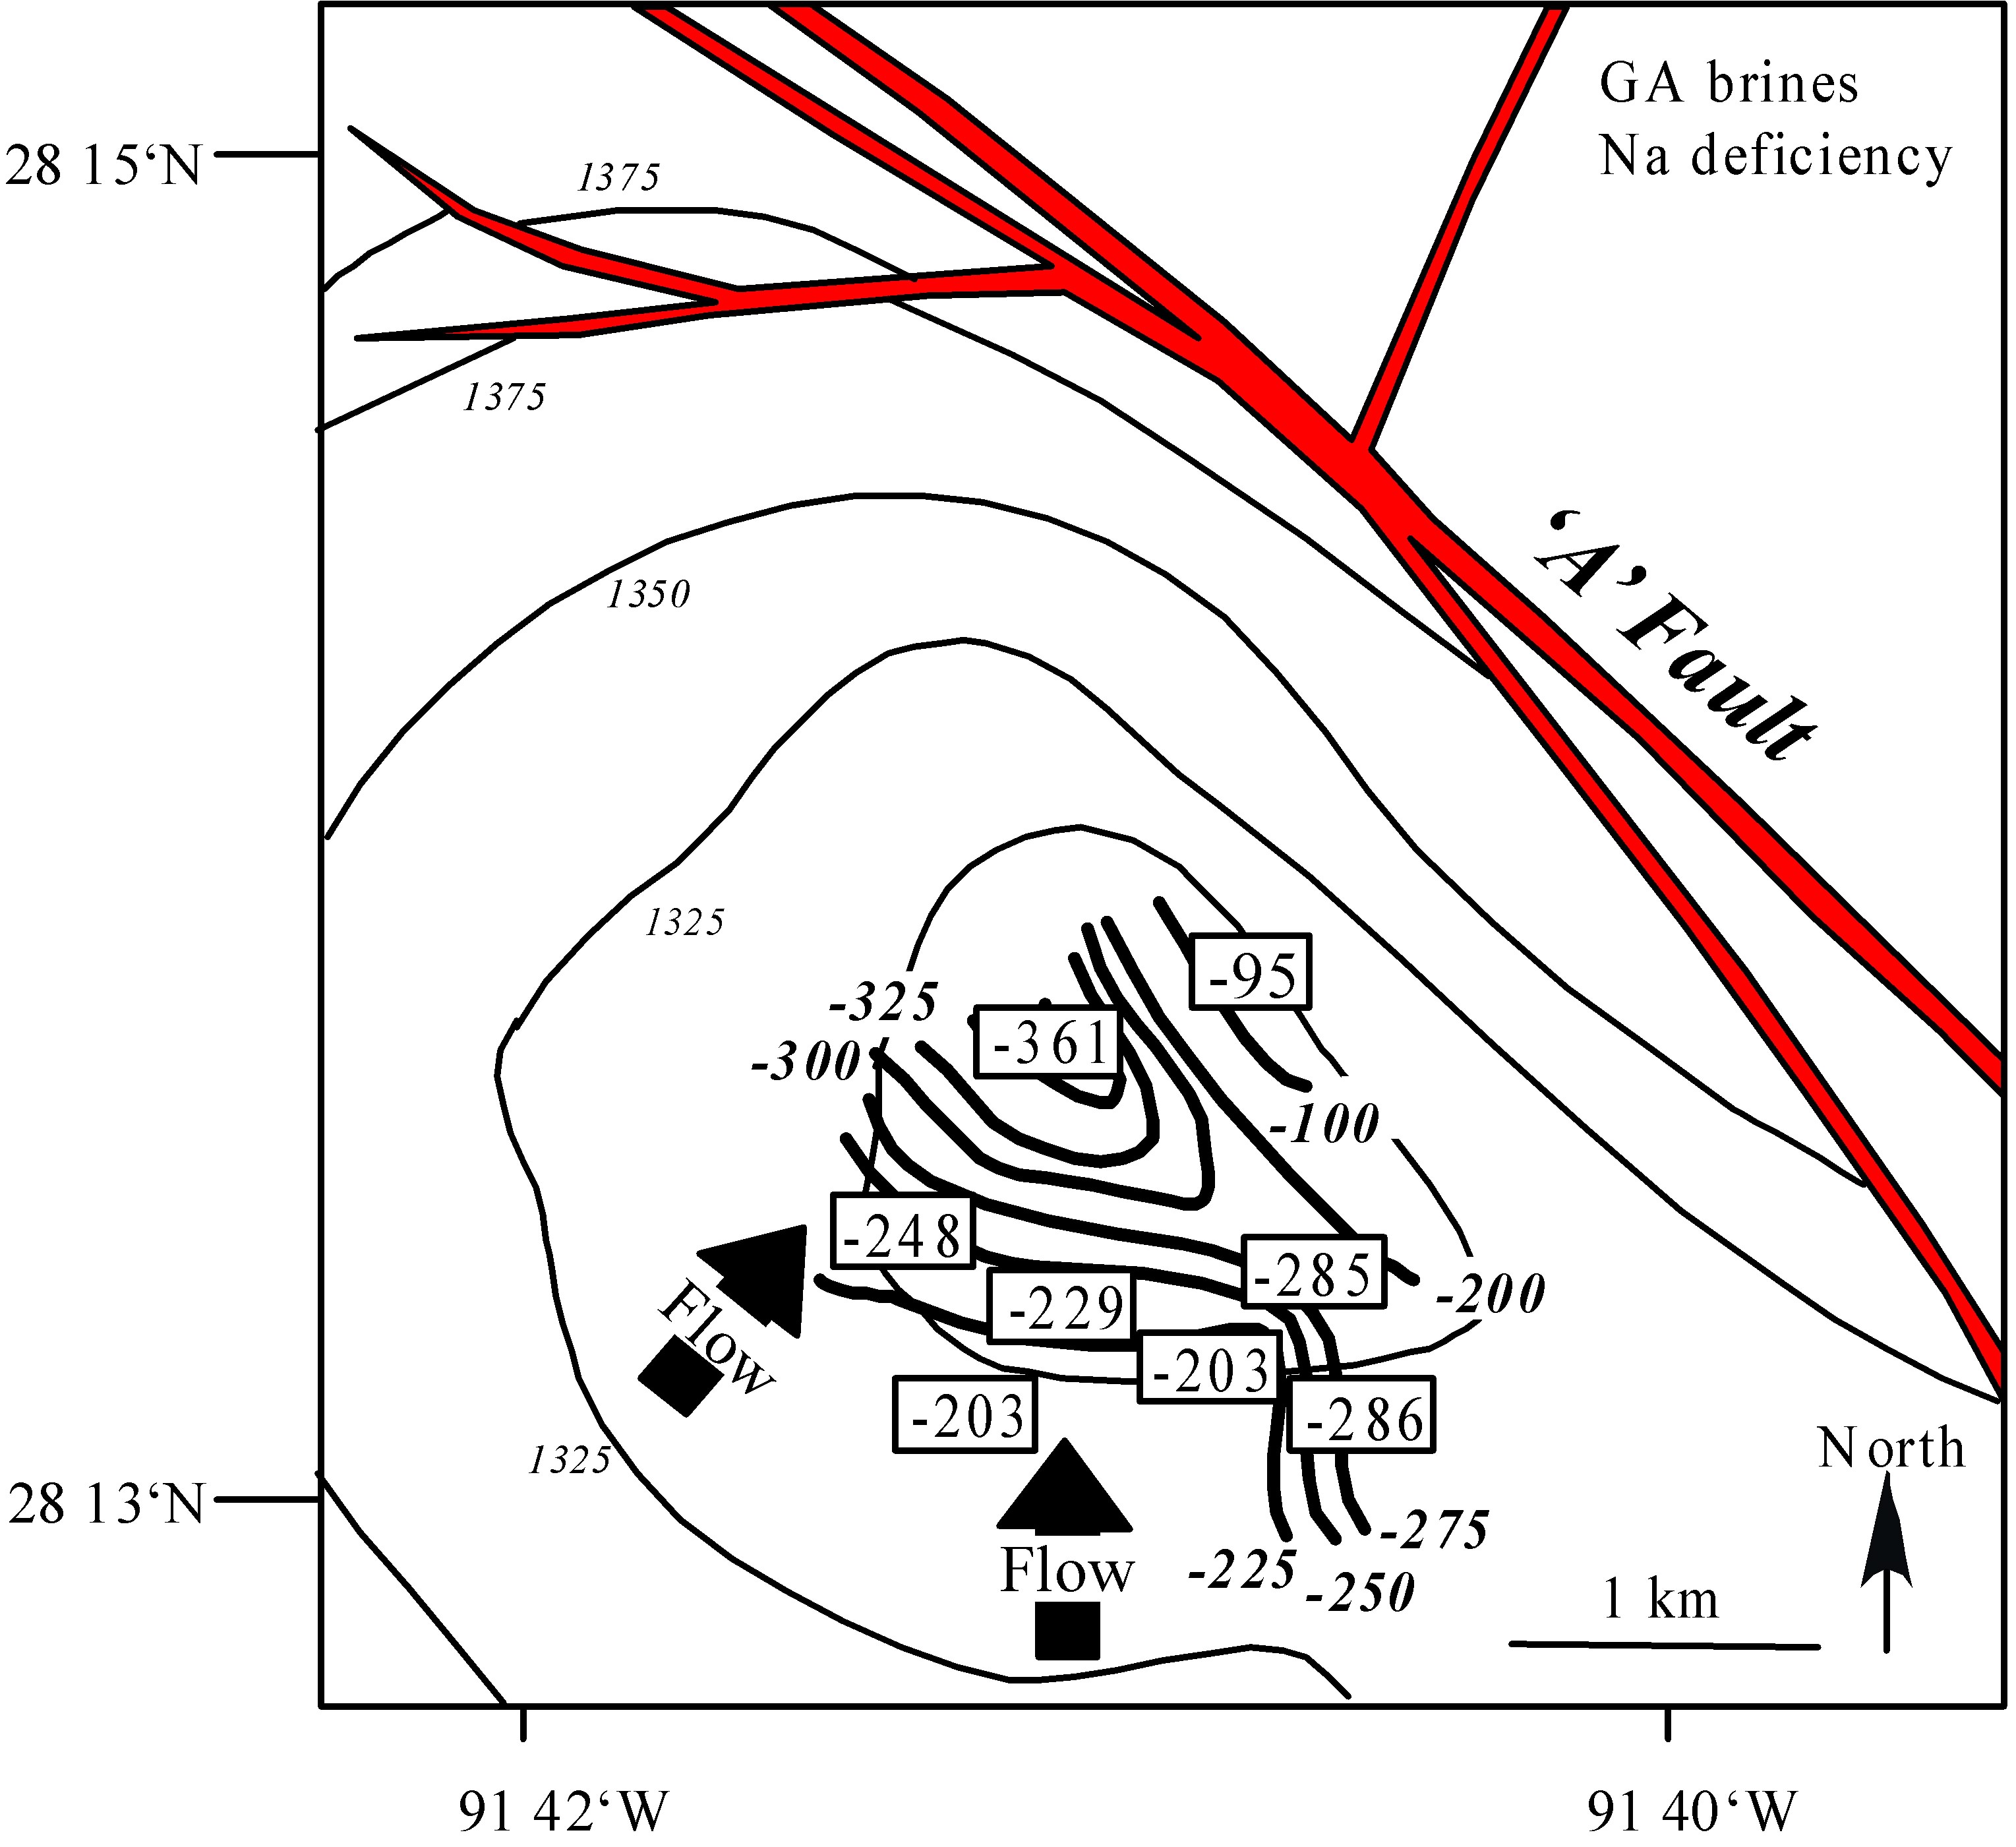
Figure 2. Structure contour map (depth in meters) of the GA sand, SEI330 Field, showing “sodium deficiency” for brines in the GA reservoir.
As brine flows through sediment, it exchanges cations with it; hence, the greater the sodium deficiency, the more sediment the brine has exchanged with. The deficiency increases to the north, indicating brine flowed from the south. The low (-95 mM) sodium deficiency value in the northeast part of the reservoir may indicate the reservoir contains brines that also flowed from the northeast. This northward flow pattern is also evident in the HB sand, about 150 meters below the GA sand.
Oil in the SEI330 Field also shows north-south compositional zonation. All oil is sourced from Mesozoic marl, and is of similar maturity, about 0.9 +/- 0.1% Ro (from Whelan et al., 1994, Org. Geochem.). Oil vanadium/nickel ratio, a source indicator, varies regularly from north to south across the GA reservoir (Figure 3), consistent with a slight source change for the oils that filled the sands. Although the ratios contain no information that allow inferences about actual flow direction, the pattern of V/Ni ratios is compatible with filling from the south.
Oil V/Ni correlates well with sulfur in the GA and HB sands. Like the V/Ni ratios, oil sulfur content varies regularly across the GA reservoir (Figure 4), and indicates that the source of the oil changes slightly during reservoir filling. The oil did not migrate directly from its Jurassic source, now buried 14 km below sea level, but instead migrated from sand to sand as it worked its way to the SEI330 reservoirs. Either the accumulation from which this oil migrated was zoned with respect to V/Ni and S, and emptied into the SEI330 reservoirs in such a way as to preserve that zonation, or oils from accumulations of slightly different V/Ni and S mixed in a regularly varying way during reservoir charging.
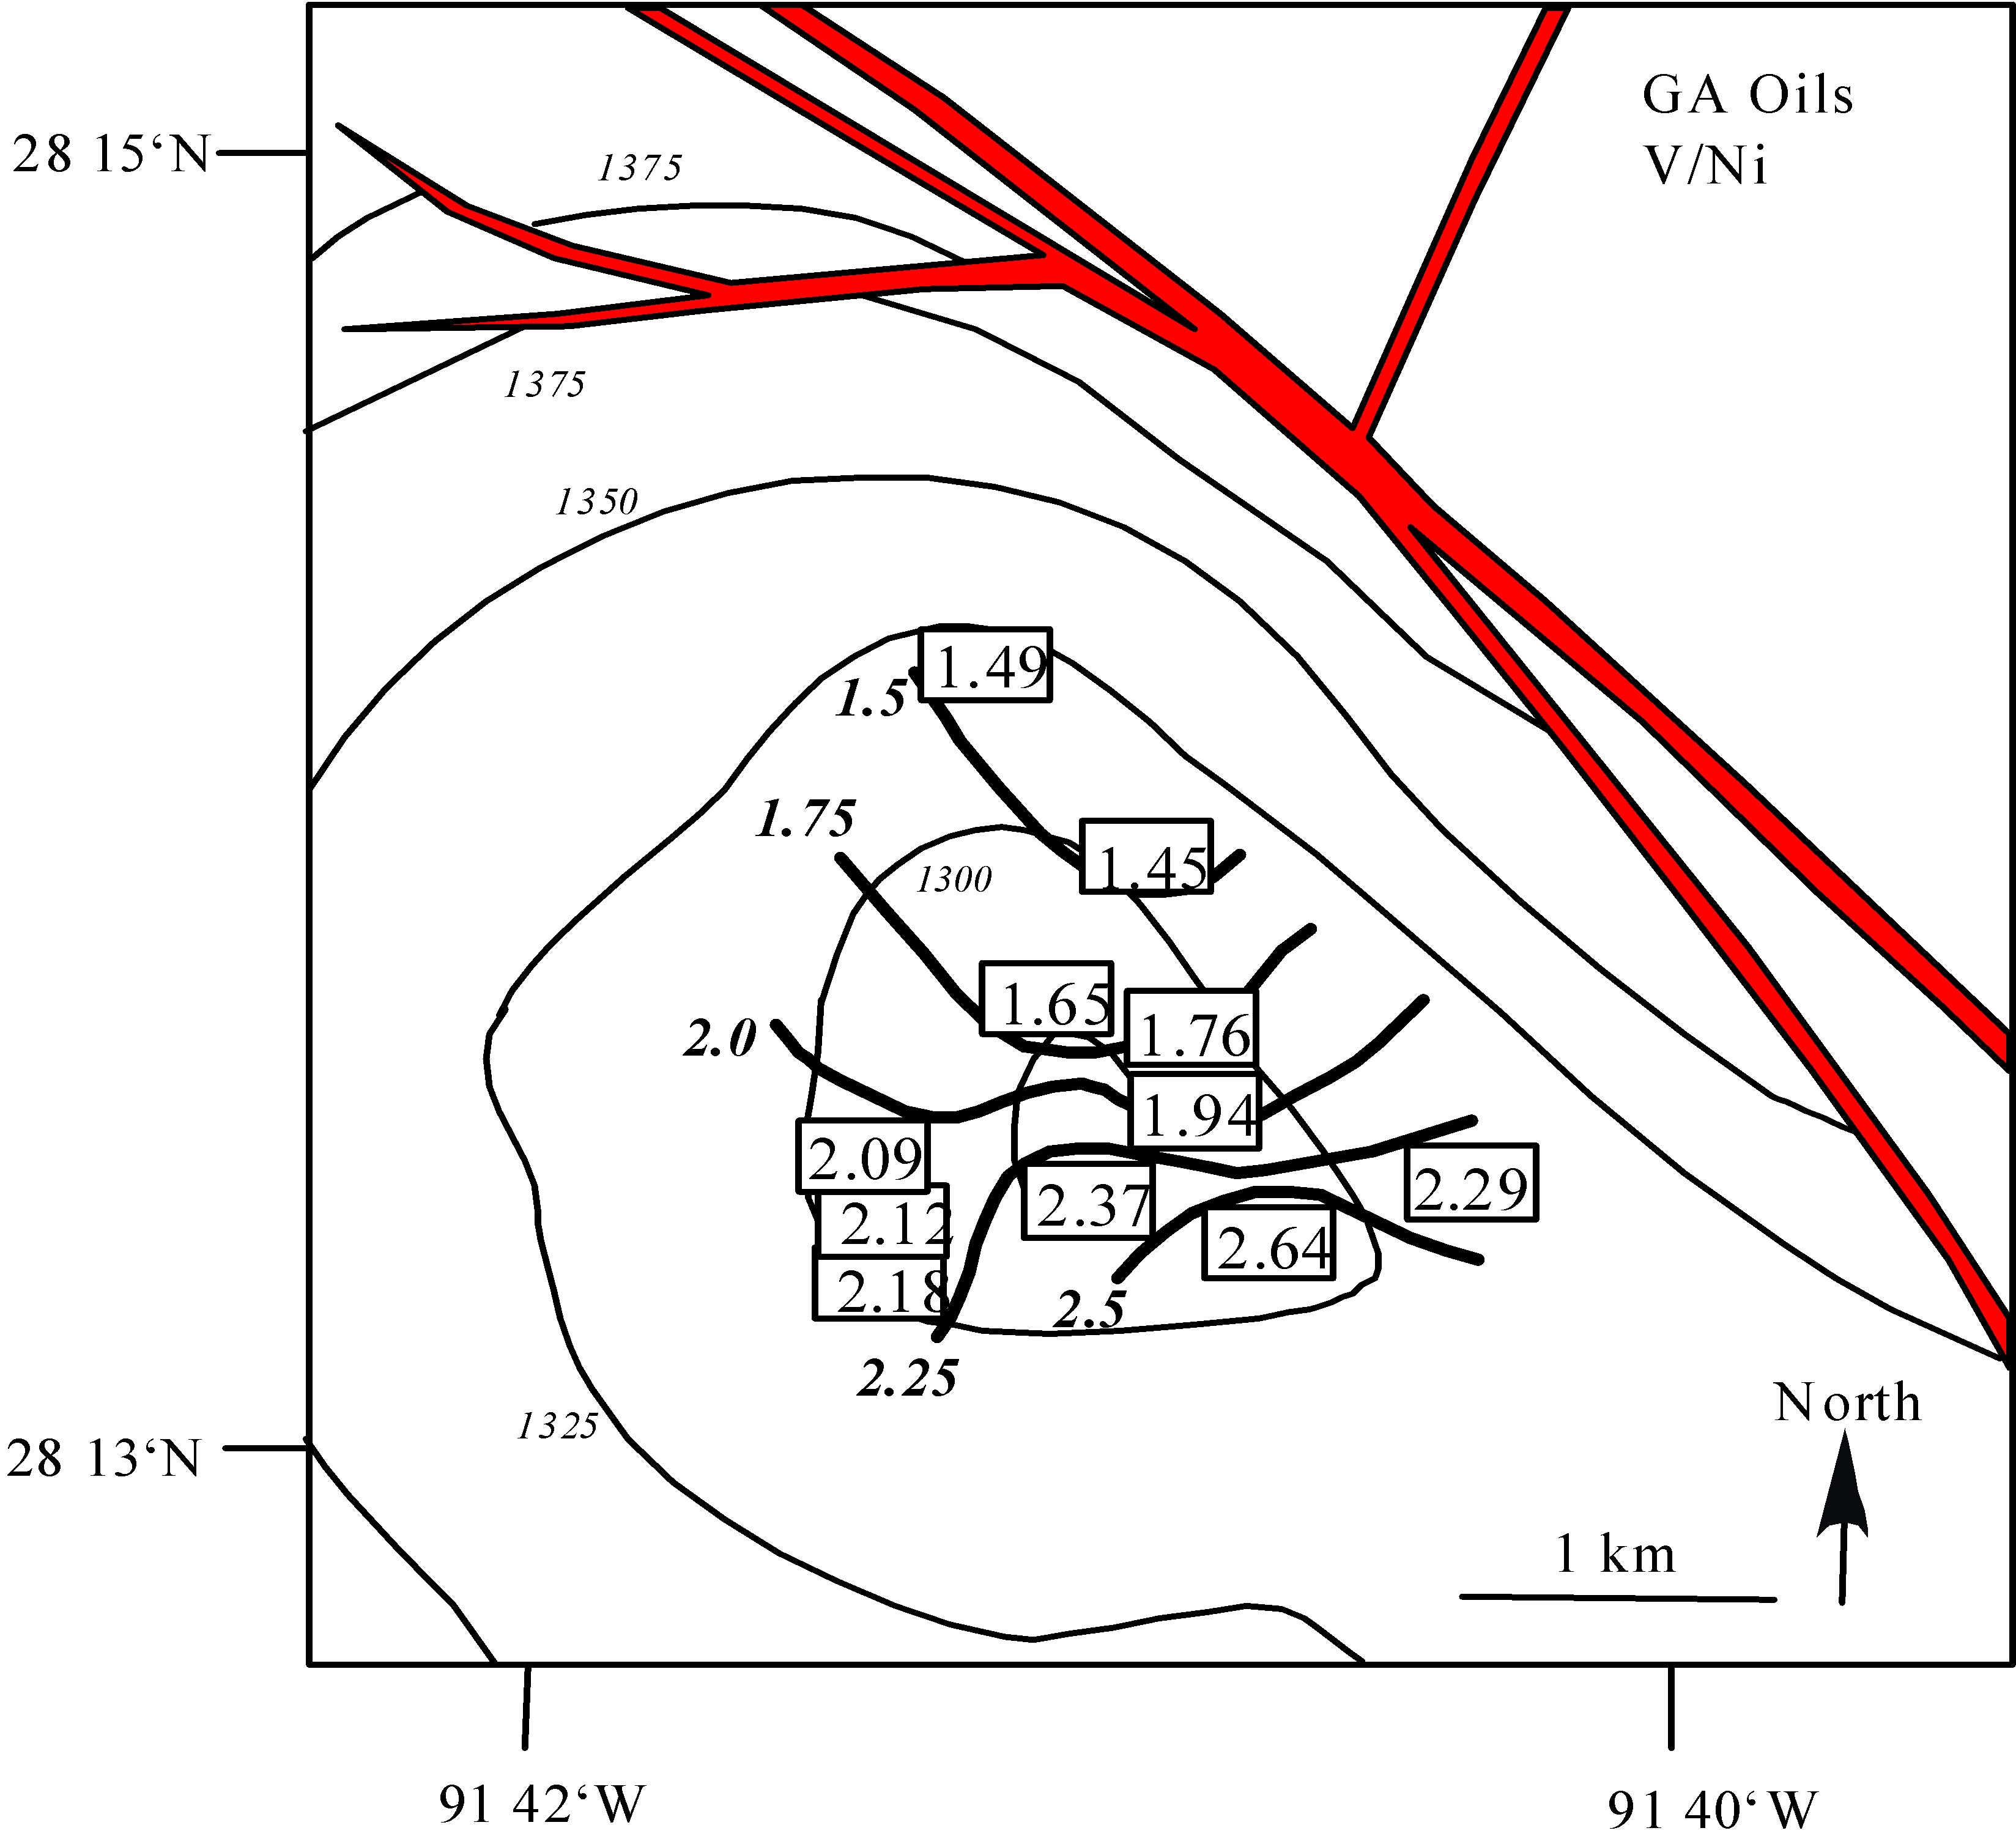
Figure 3. Structure contour map of GA sand, showing oil V/Ni ratios. The ratios show a north-south zonation consistent with filling from the south, as determined for the GA brines. A similar pattern is observed in the HB reservoir, 150 meters deeper. Structure contours are in meters below sea level.
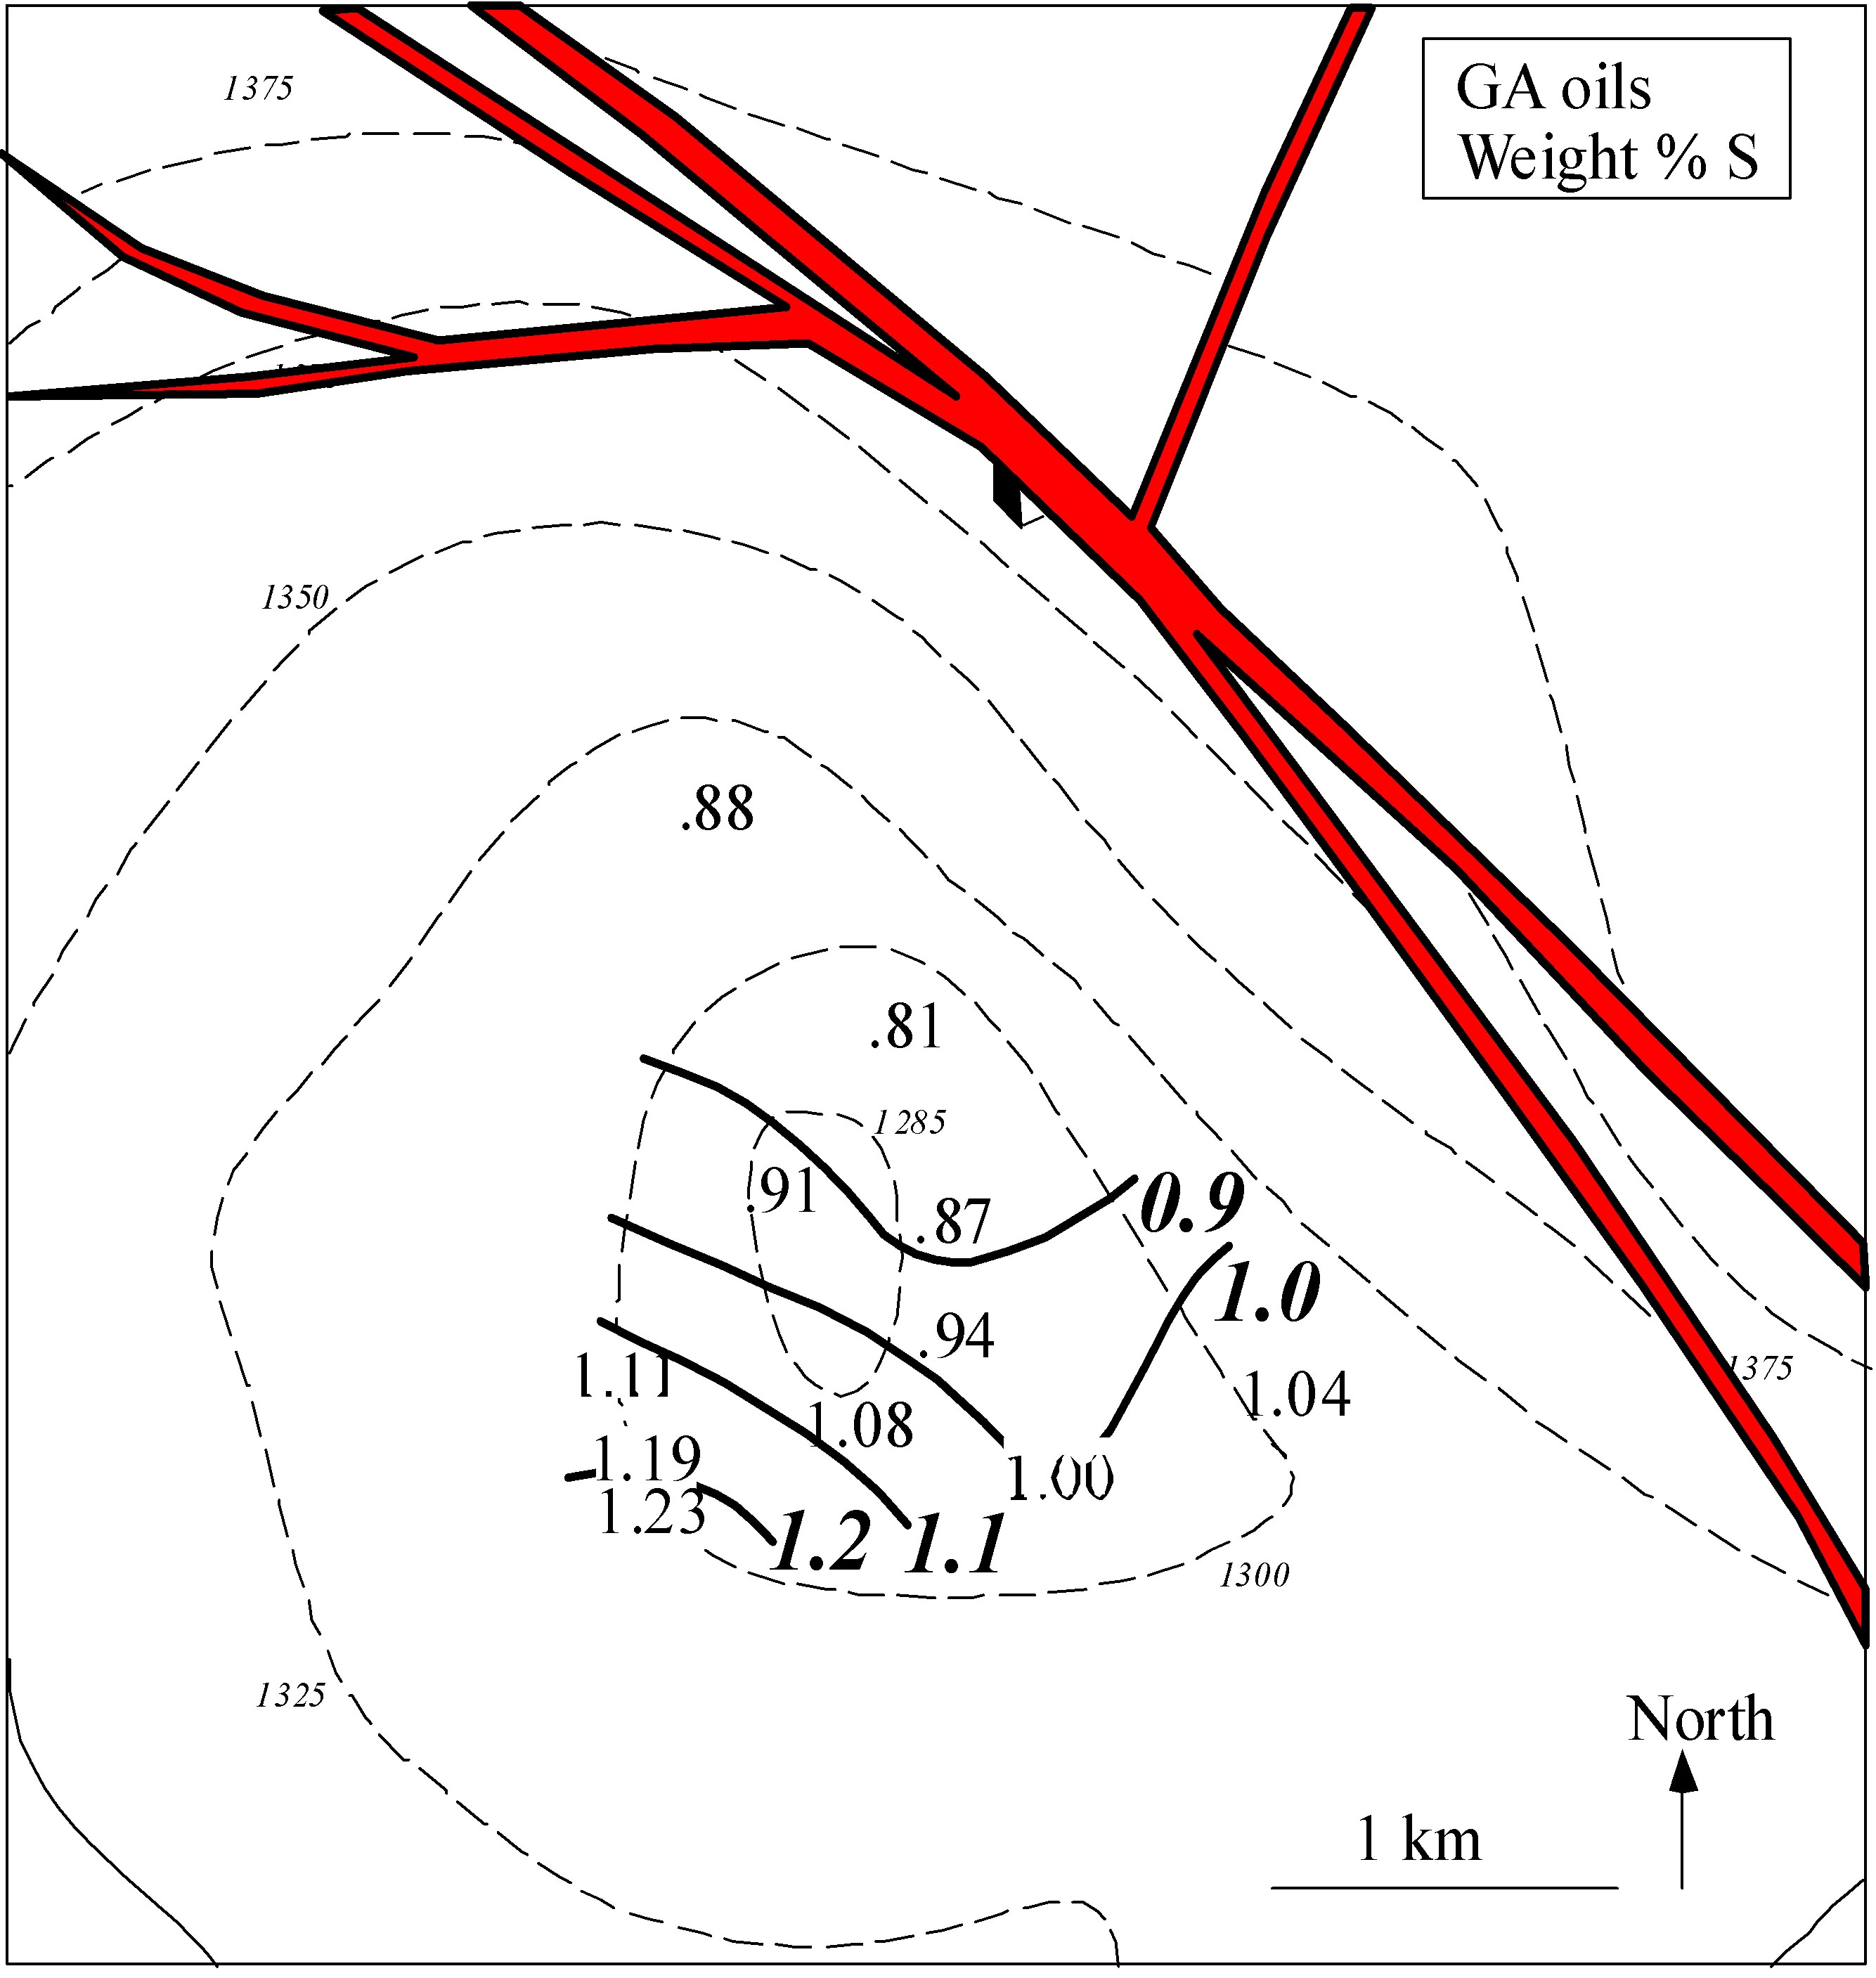
Figure 4. Structure contour map of GA sand, showing percent sulfur in the GA oils. Sulfur content shows regular variation across the reservoir, consistent with filling from the north or the south. A similar pattern is present in the HB reservoir.
Biodegradation of SEI330 oil provides a useful tool for determining the timing of reservoir filling, based on the widespread observation that bacterial degradation of oil has an upper temperature limit, referred to as the “sterilization temperature.” During biodegradation, n-alkanes are consumed more readily than isoprenoids. Mildly to moderately biodegraded oils are characterized by ratios of isoprenoid to n-alkane (e.g., pristane/nC17) greater than 1.0. Unbiodegraded oil is inferred to never have been at temperatures below the “sterilization temperature,” hence they filled reservoirs after they had been already buried to the depth at which that temperature is encountered.
Oils that have Pristane/nC17 ratios greater than 1.0 are all shallower than 6600 feet depth in the SEI330 field, and no oils below that depth are biodegraded (Figure 5). Thus, the “sterilization temperature” is concluded to be 65 C, the temperature that corresponds to that depth. Reservoirs containing only unbiodegraded oil (LF, NH, OI) must have filled after they had been buried through the 65 C isotherm. Using the late Quaternary sedimentation rate for SEI330, these reservoirs are constrained to have been filled within the past 120,000 to 230,000 years. Unbiodegraded oil in shallower reservoirs must have migrated there within the past few thousand years, the timescale of methanogenic bacterial degradation of oil in subsurface environments.
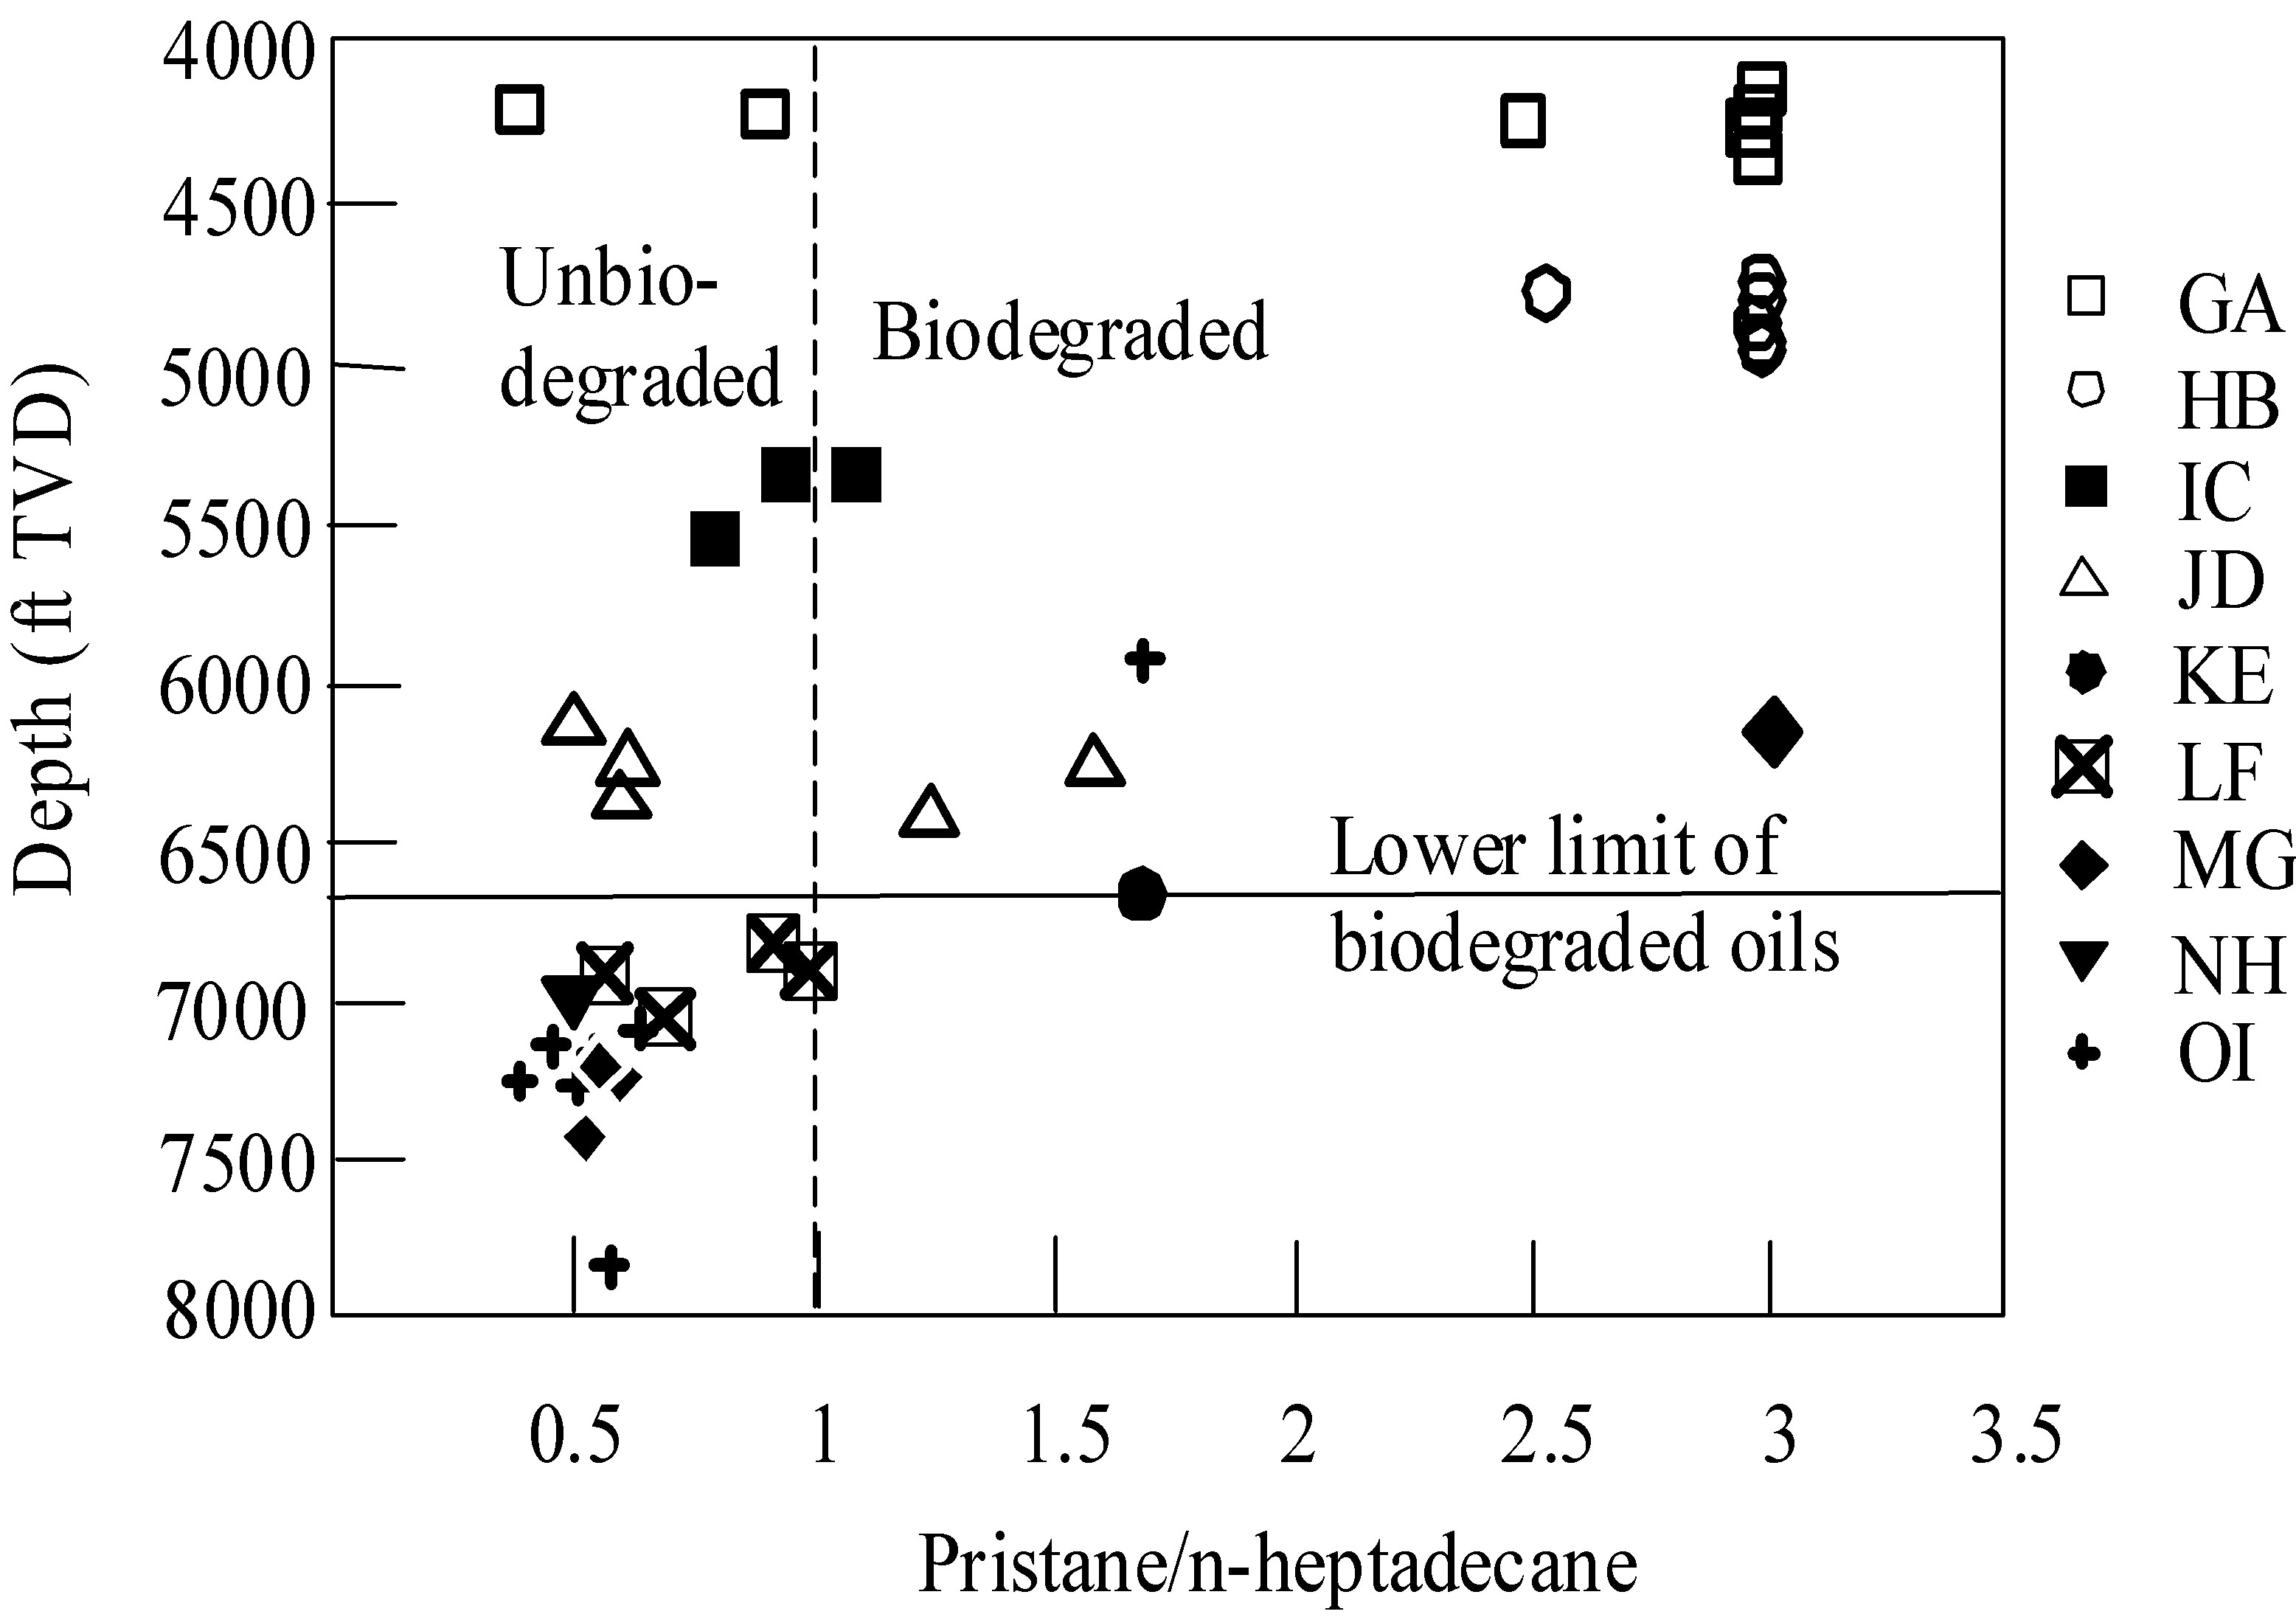
Figure 5. Pr/nC17 versus depth, SEI330 oils. Many GA and HB oils have lost both pristane and n-heptadecane, and are plotted here at an arbitrary Pr/nC17 value of 3. The presence of only unbiodegraded oil below ~6600 feet (@65 C) indicates these reservoirs were filled at temperature above 65 C, or within the last 120,000 – 230,000 years of burial.
Gas Washing of Oil
Gas washing involves removal, by evaporation, of compounds from oil into a mobile vapor phase (gas) that bubbles through the oil and then separates from it. It is described in more detail here. Gas washing has affected SEI330 oils in a distinctive way. The deepest reservoir, the OI, contains gas-washed oils. The most-fractionated of these has lost about 15 weight percent of its initial content of nC10+. Equation of State modeling indicates these oils were washed at pressures of up to 6200 psi at depths slightly greater than the OI sand, and that about 14 moles of gas were involved in washing one mole of oil. Overlying reservoirs contain mostly unfractionated oil, indicating that the OI oils have not leaked into shallower sands. The JD sand, about 1000 feet above the OI, contains an evaporative gas condensate that is isotopically and chemically paired with the OI oil. Here, as at Tiger Shoals, gas-washed oil occupies one reservoir while its paired condensate lies mainly in another.
In the OI sand, one fault block contains evaporative condensate juxtaposed with another fault block that contains gas-washed oil, as shown in Figure 6. From initial BHP measurements, we know that the within-reservoir fault (‘F’ Fault in Figure 6) that separates the two accumulations supports a capillary pressure of about 130 psi (higher pressure is in Fault Block A, Figure 6), and probably leaks at higher pressure differentials. The geometry of the system is indicative of filling of the OI sand mainly from the south. First, the gas condensate charged the OI sand, followed by the residual oil that displaced the gas across the leaky fault. Given that the OI oil is paired with the JD condensate, the JD sand also probably filled from the south.
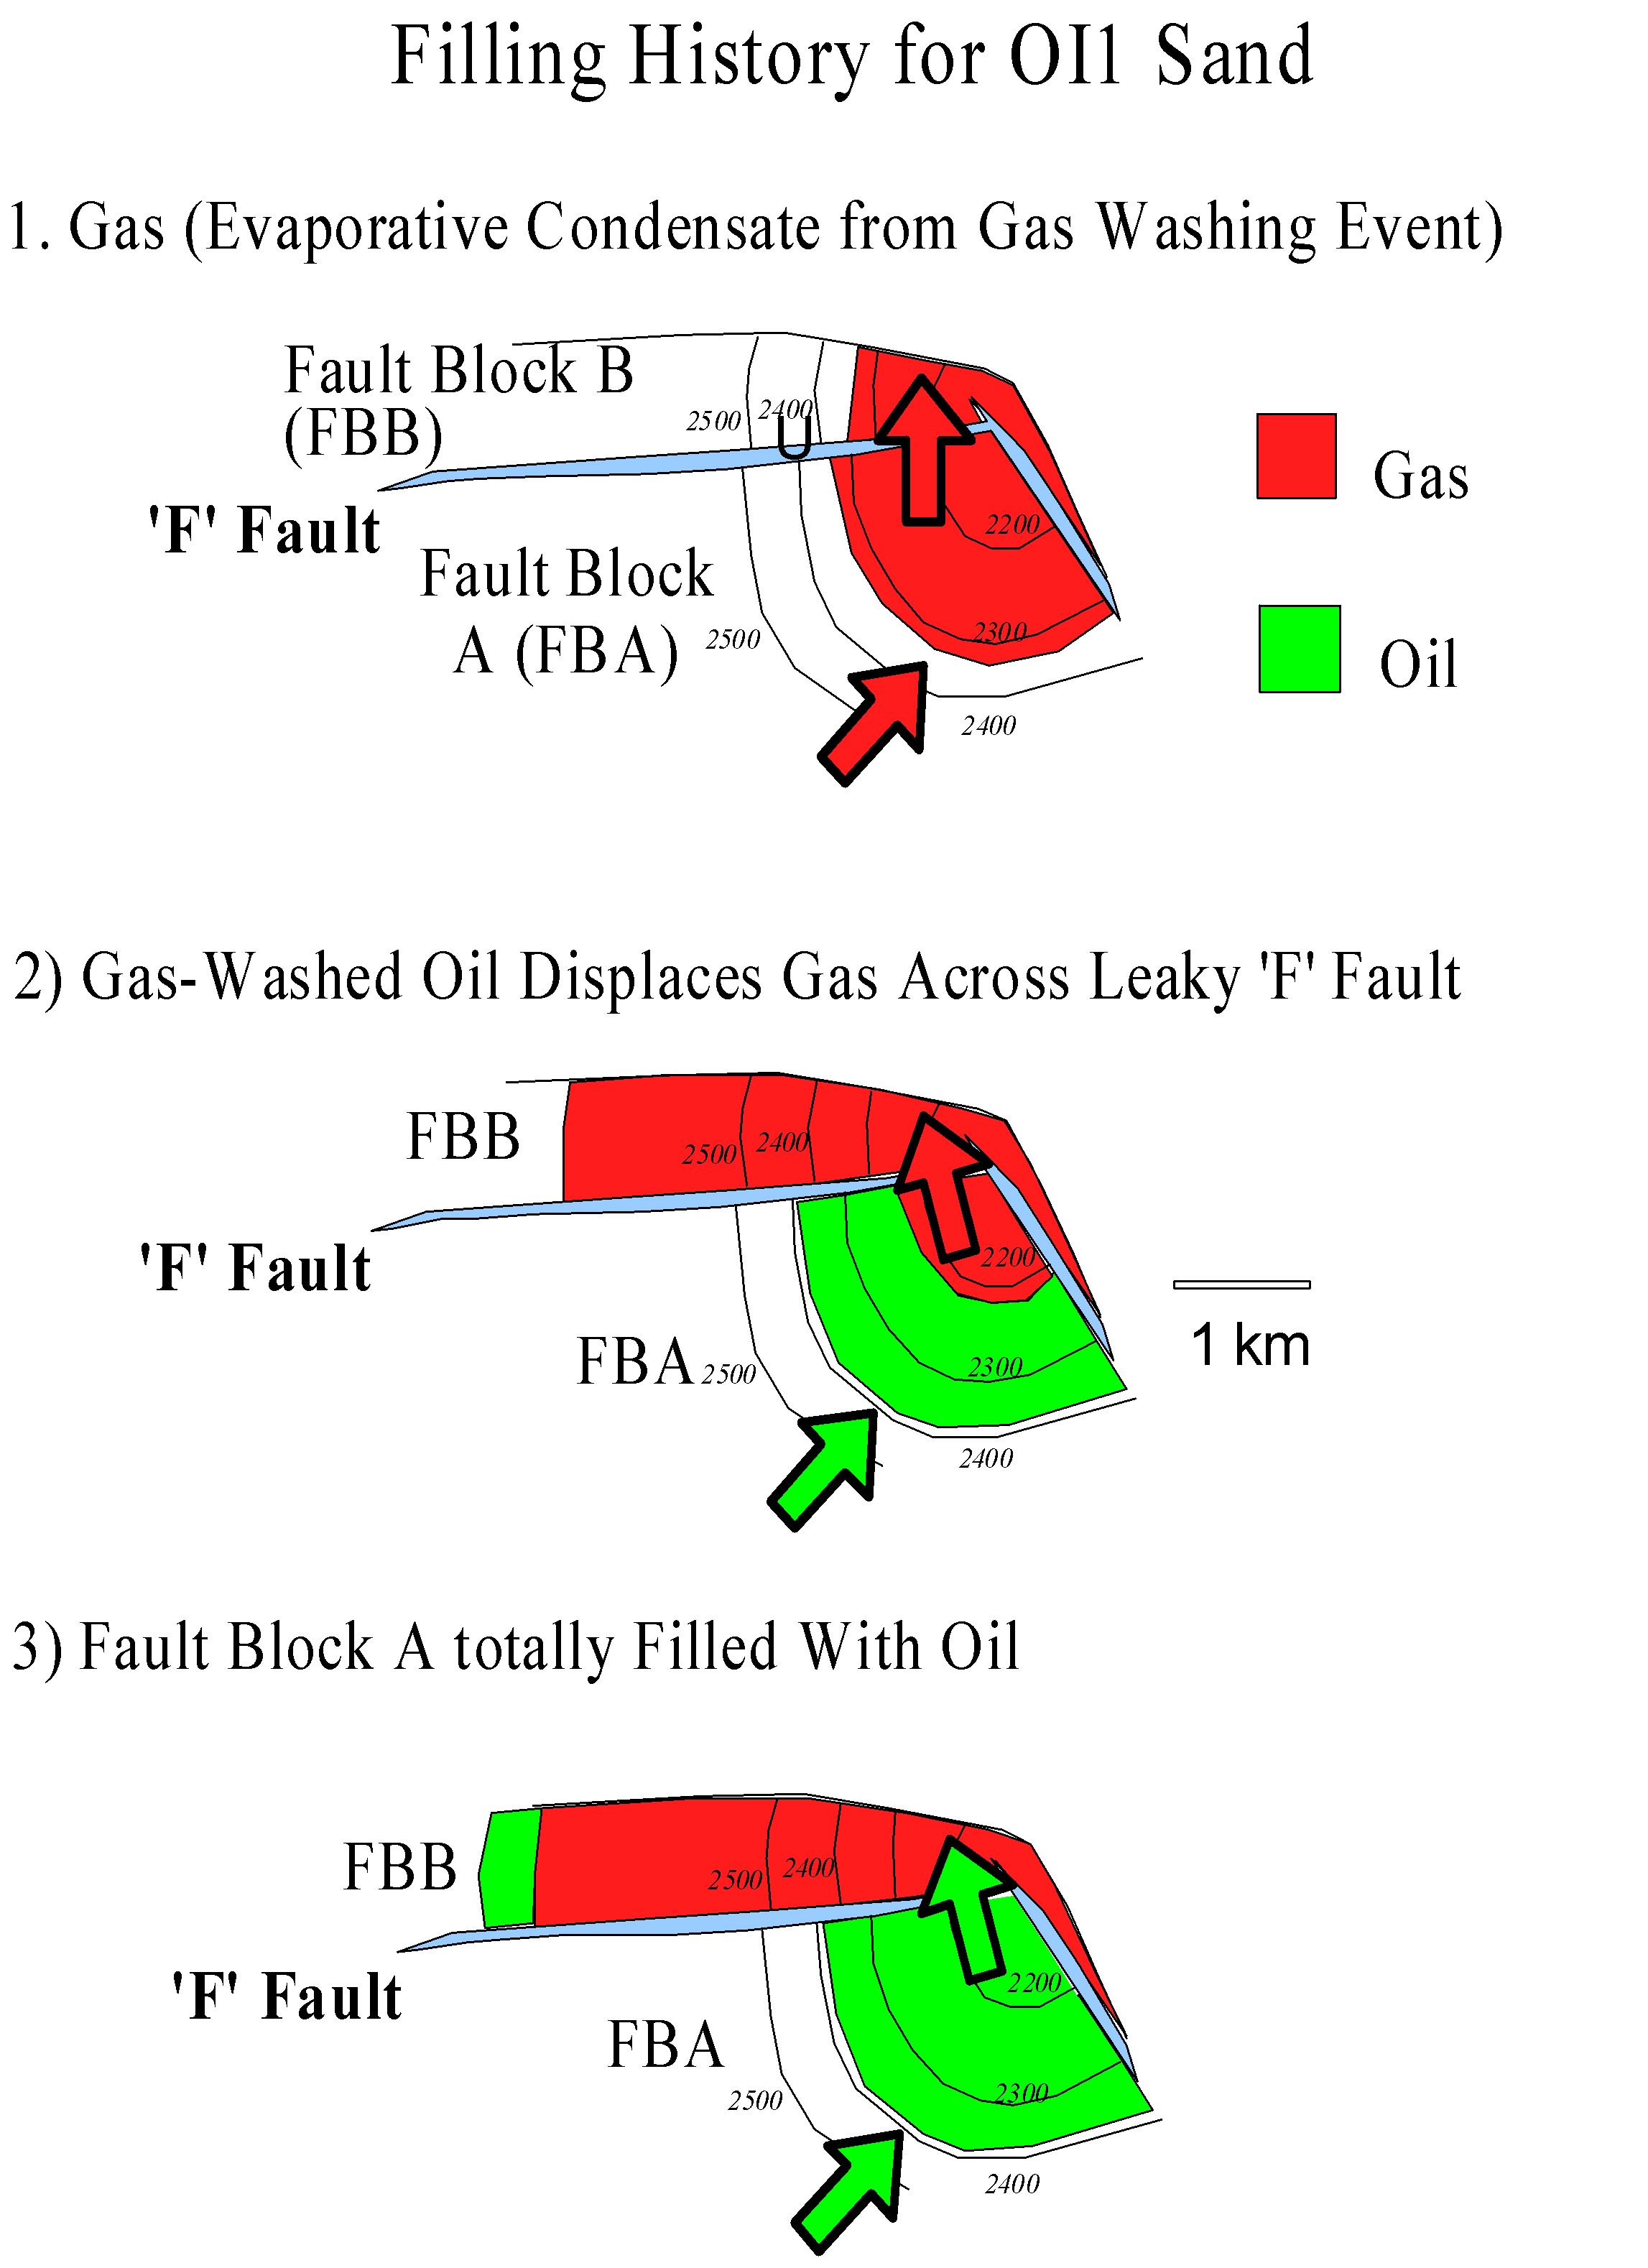
Figure 6. Structure contour map on top of OI1 sand, Block 330 field, contours in meters below sea level. The distribution of hydrocarbons is consistent with filling from the south, similar to the GA and HB reservoirs.
The GA, HB, JD, and OI reservoirs have apparently filled primarily from the south. Other sands have been shown by Losh et al. (2002 AAPG Bull) to have filled from the north and east, as well as the south. Although the ‘A’ Fault has acted as a fluid conduit to the extent that it is a paleothermal anomaly, the Antithetic Fault may have transmitted a yet greater volume of fluid to the reservoirs.
The different SEI330 reservoirs contain fluids that are distinct from one another. GA brines have twice the salinity of HB brines. OI oils are gas washed whereas most other SEI330 oils are not. Oils in the MG and LF reservoirs have different heavy n-alkane distributions and lower sulfur content than do oils in the NH and OI reservoirs. Overall, there is not only lateral heterogeneity within reservoirs, but vertical heterogeneity between them. The latter points to a complex migration network that delivers different fluids to different reservoirs, as shown in the schematic model of Figure 7. The fault conduit is thus variable in space as well as time.
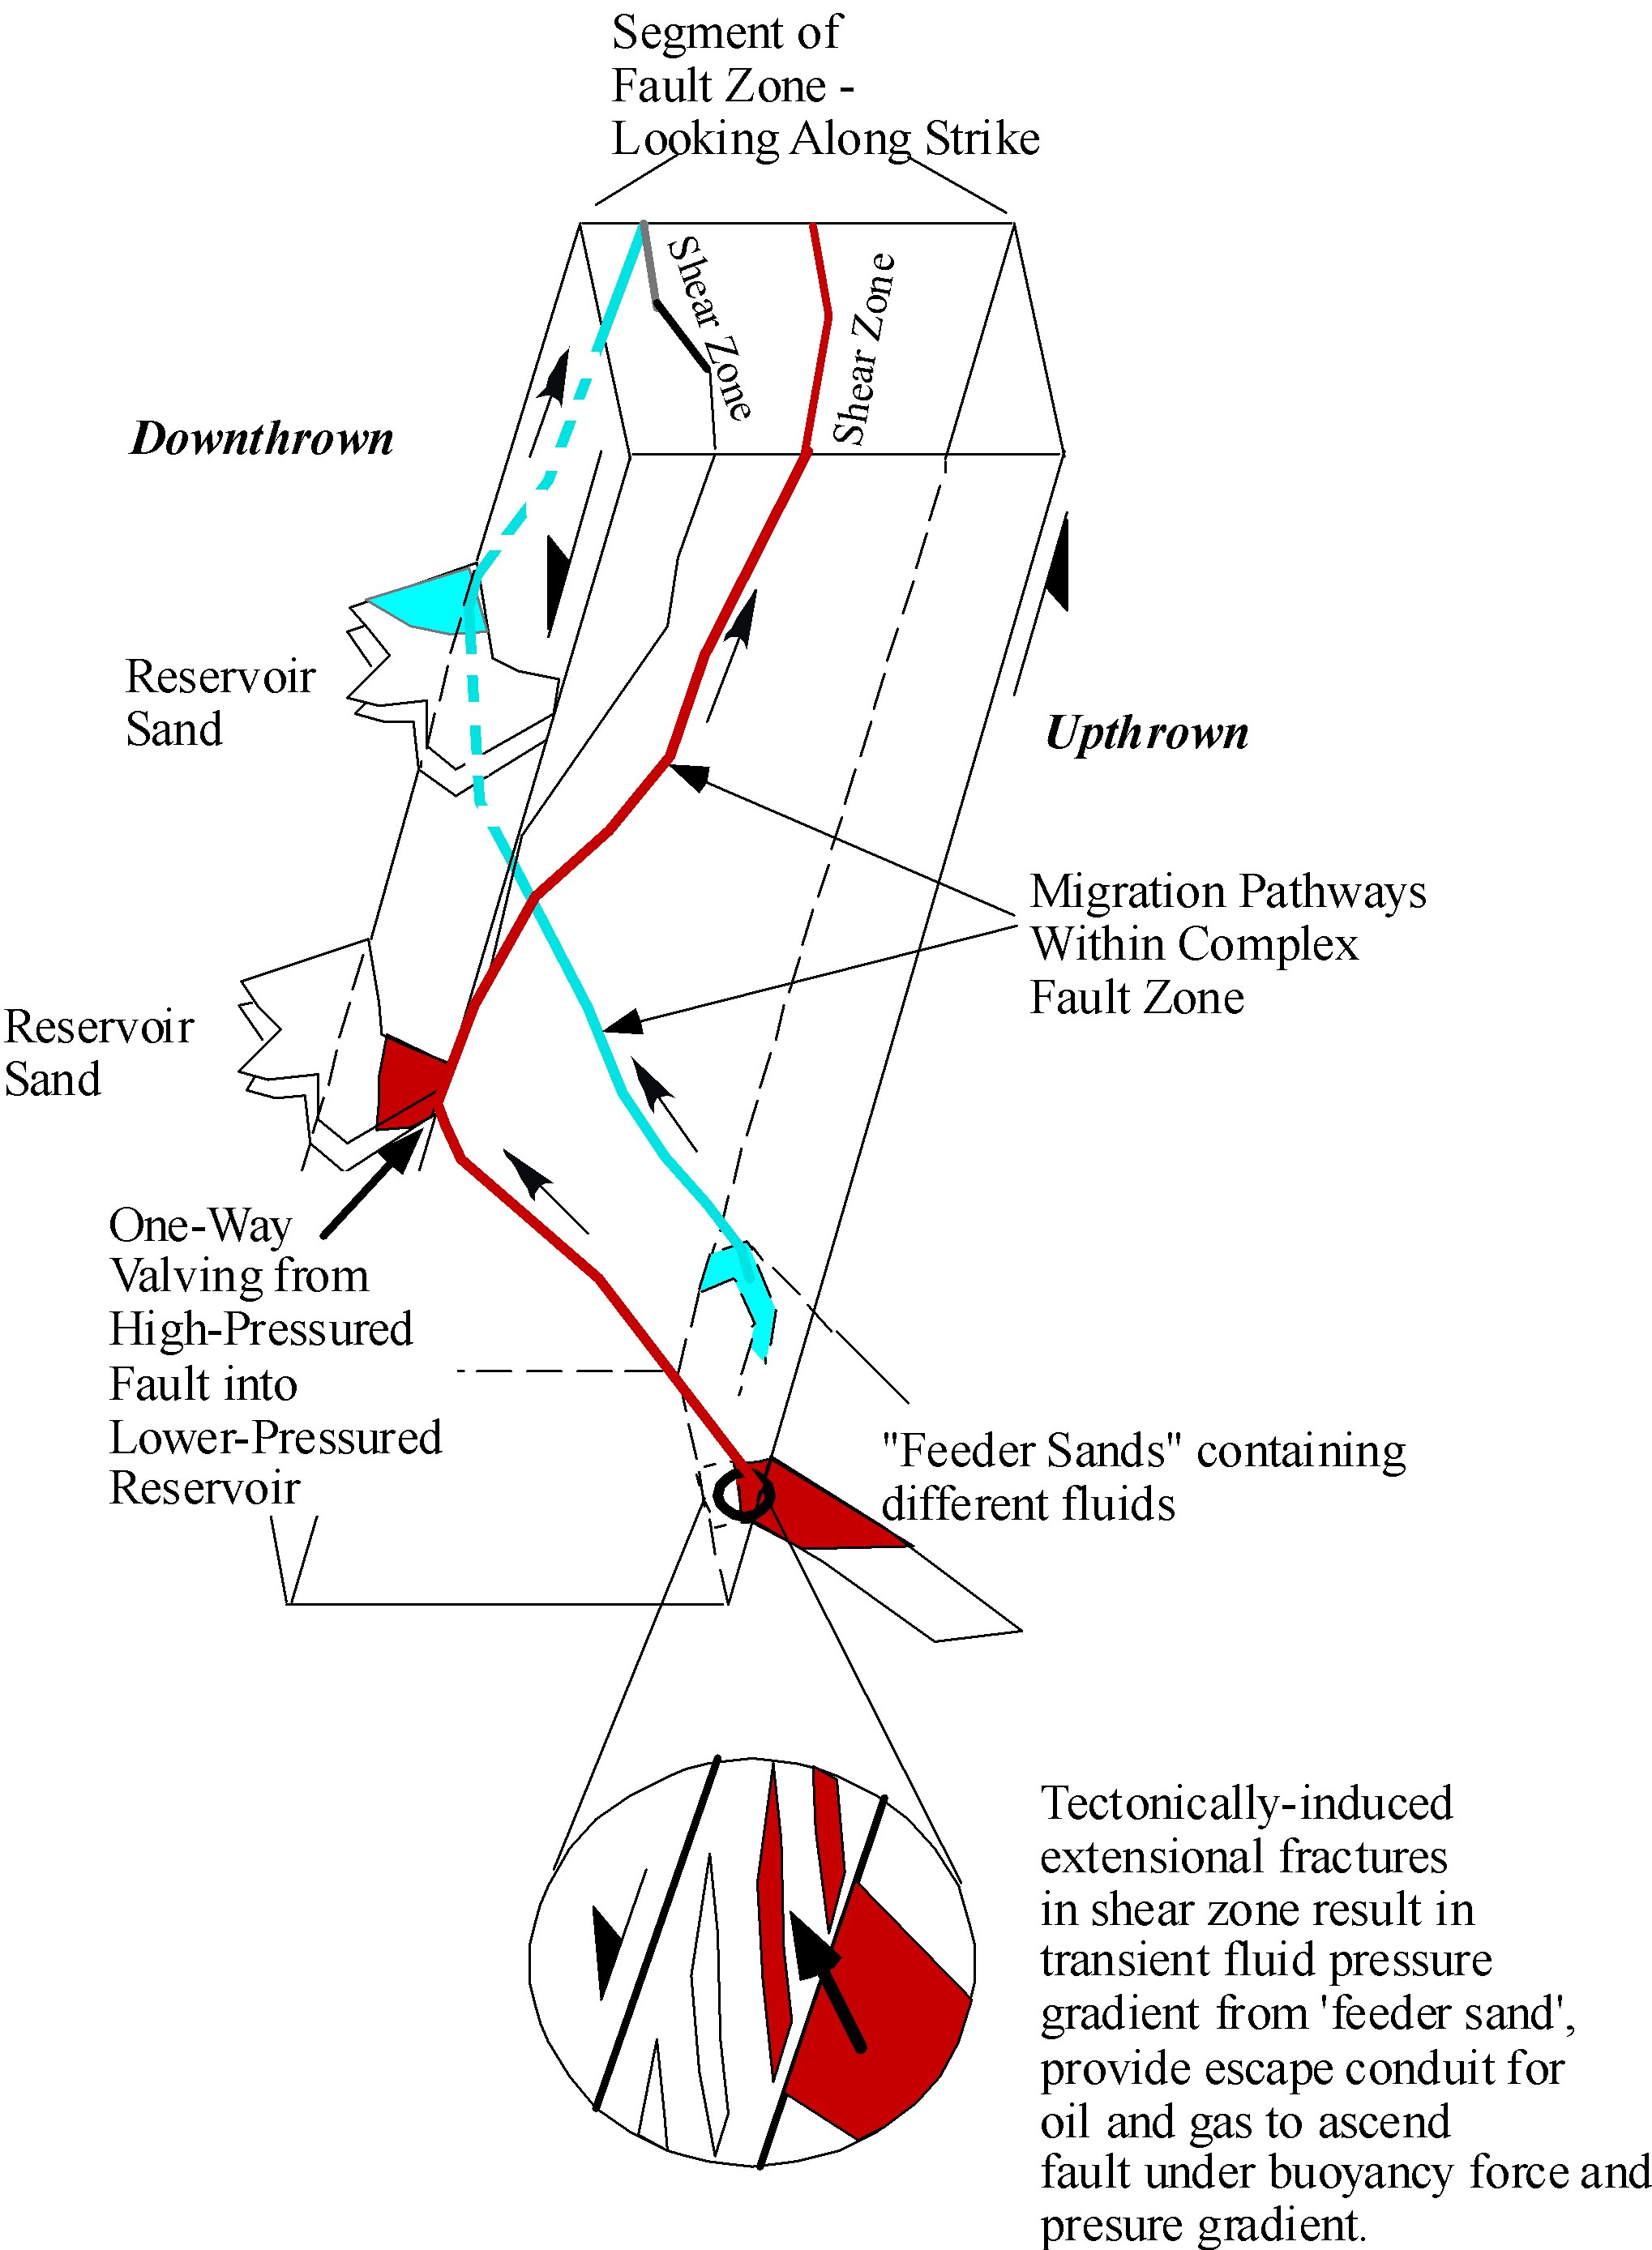
Figure 7. Schematic model of fault conduit linking deep “feeder sands,” containing accumulated hydrocarbons, to known reservoirs at SEI330. The fault zone is complex in three dimensions, and appears to link different deep accumulations with different reservoirs.