
Losh, S., Eglinton, L., Schoell, M., Wood, J., 1999, AAPG Bull. v 83, pp. 244-276; Haney, M., Sneider, R., Sheiman, J., Losh, S.,2005, A moving fluid pulse in a fault zone;Nature, v. 437, no. 7055 (1 September), p. 46
At the South Eugene Island Block 330 field, the minibasin-bounding ‘A’ Fault (map is here) is a paleothermal and geochemical anomaly with respect to sediment on either side of it. Vitrinite reflectance, stable isotope, and other data show that the fault has been a conduit for fluid flow from depth. As shown in Figure 1, the fault stands out with respect to thermal maturity. Most notably, vitrinite reflectance in the fault zone in the A6ST well is as high as 0.58% Ro, substantially higher than 0.3%Ro values just a few hundred feet away from the fault (Figure 2). The ‘A’ Fault in the A6ST well is also characterized by an oxygen and carbon isotope anomaly (Figure 2).
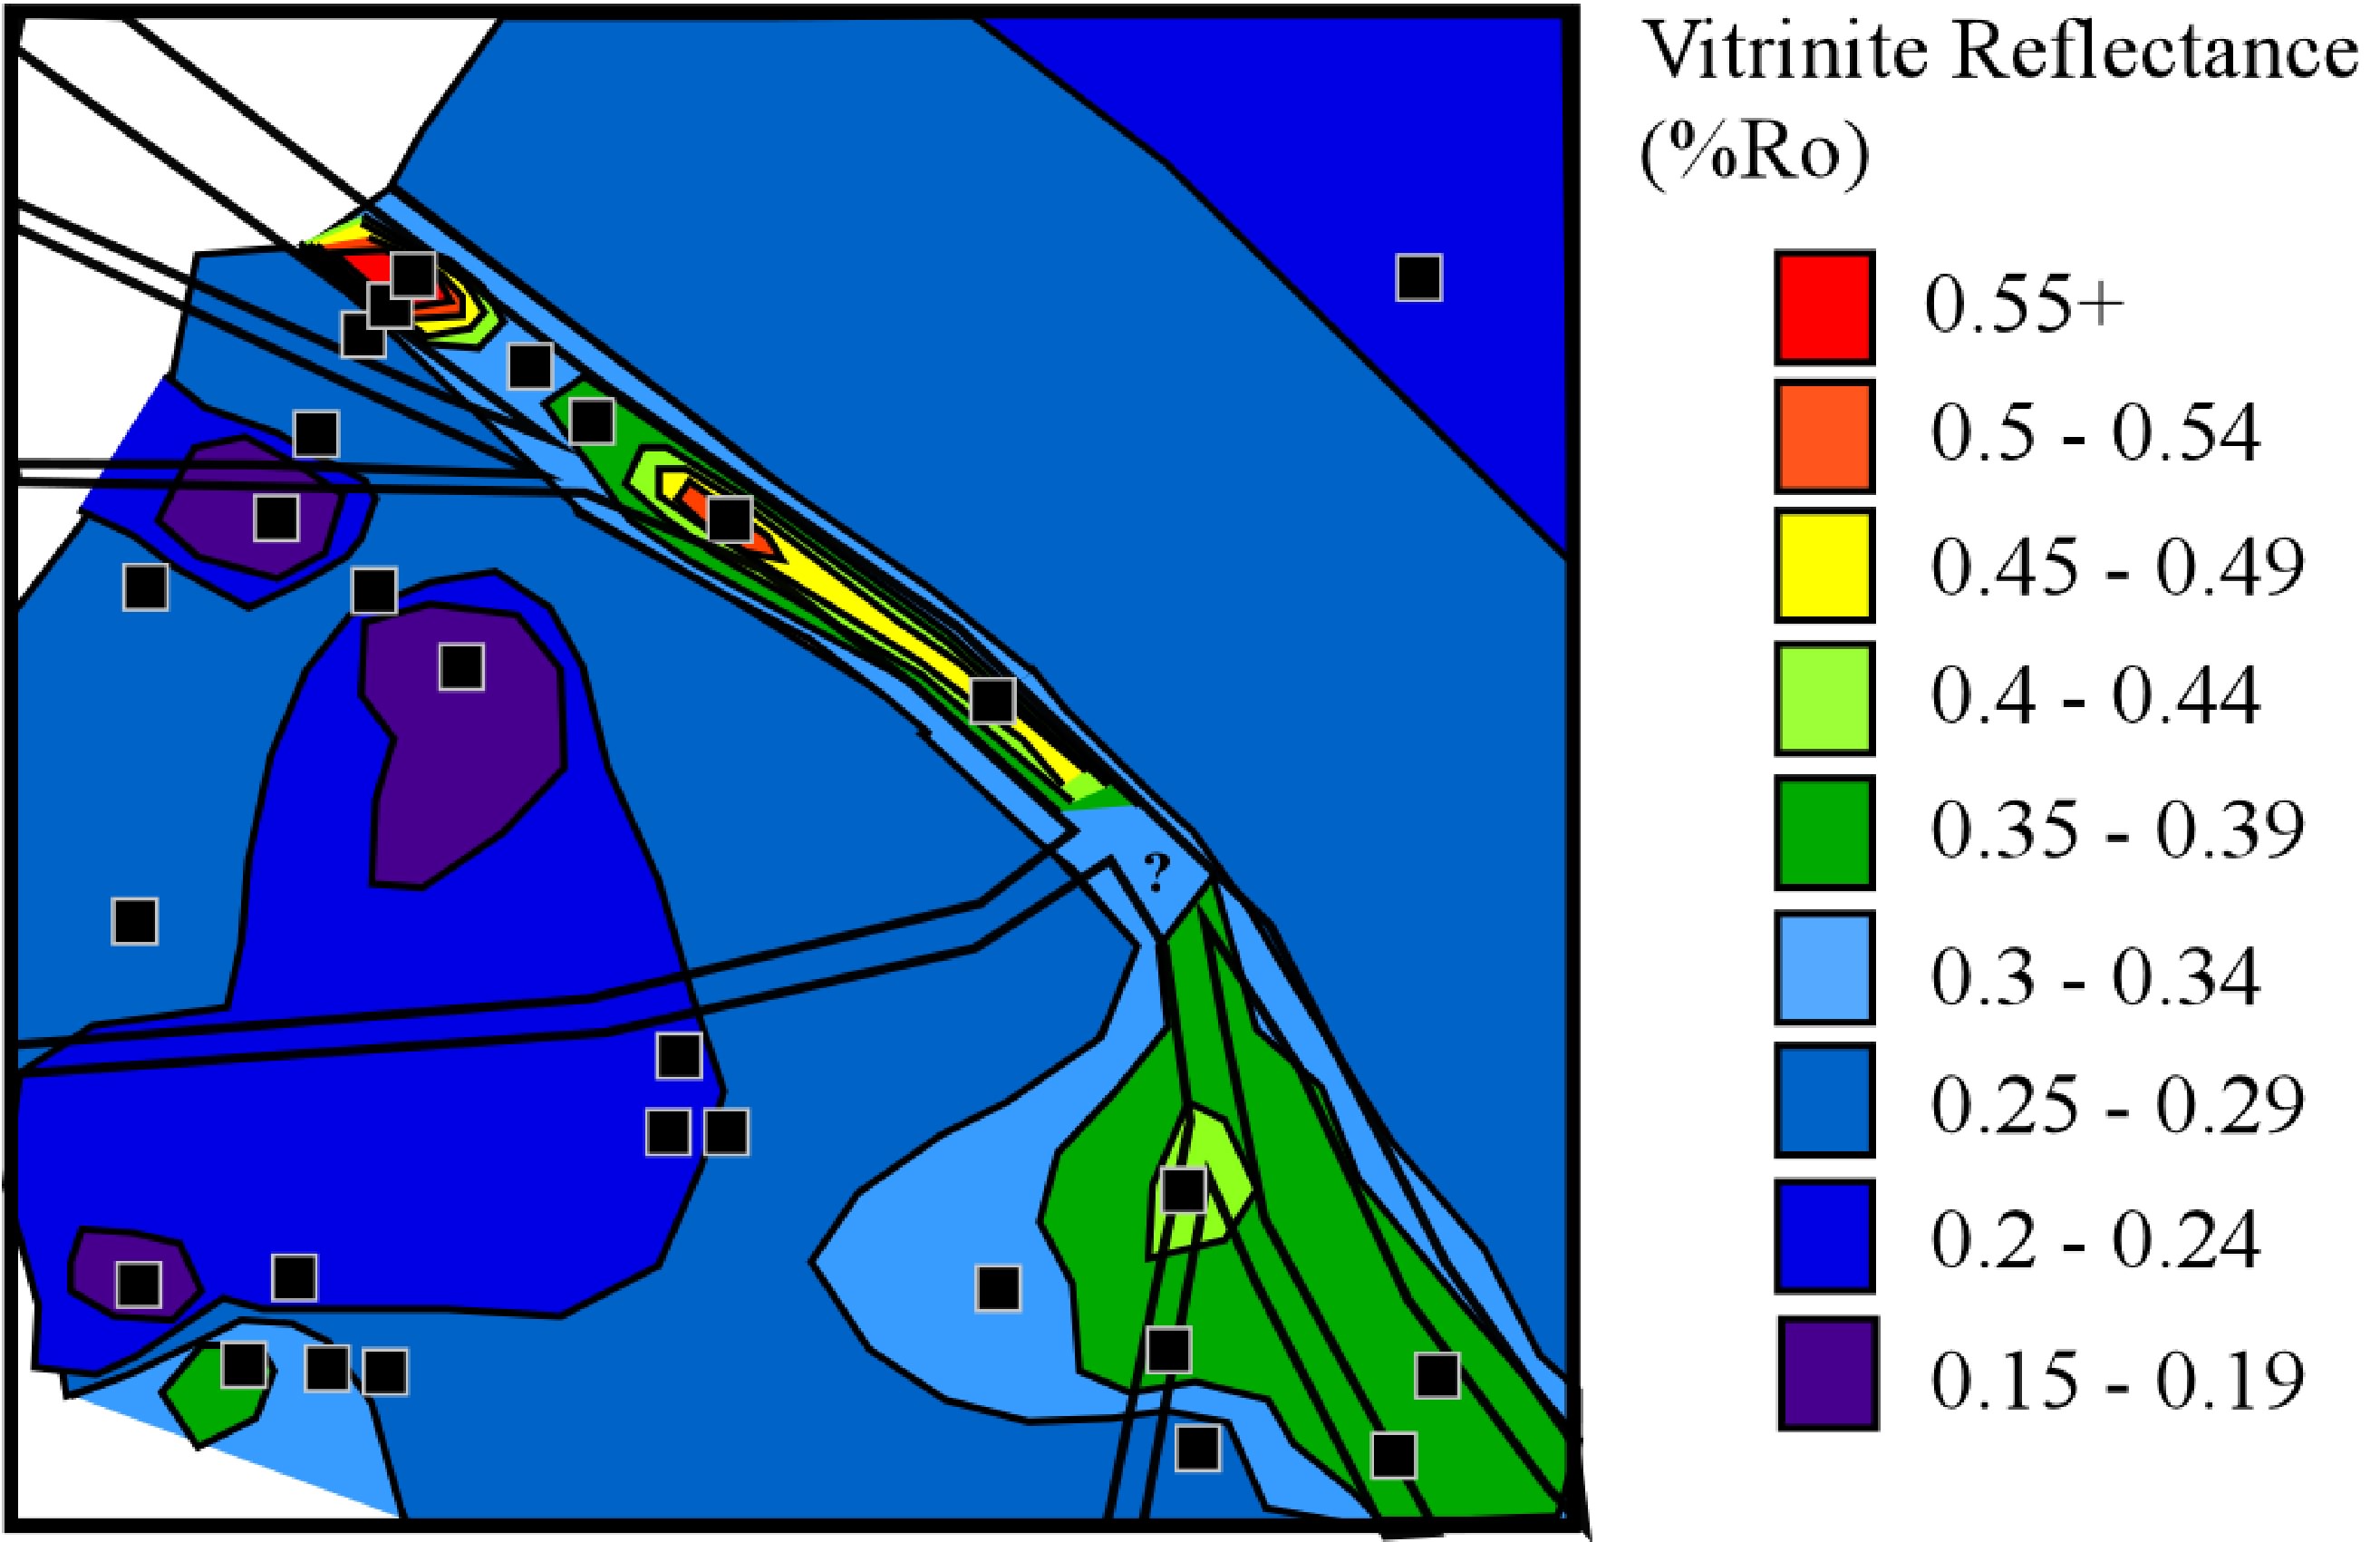
Figure 1. Contour map of average vitrinite reflectance values for fault samples and reservoir sediments (squares) in SEI330 Block 330 (outline shown, 3 miles on a side). Data points are shown as black squares. %Ro contours in the fault in the central portion of Block 330 are based on comparison with the steep vitrinite reflectance gradient documented at the fault in the A6ST well (Figure 2). The fault is a pronounced paleothermal anomaly. Other geochemical data indicate this is due to rapid fluid flow up the fault (after Losh et al., 1999). Faults are shown at the level of the JD sand; samples are from depths of 6000 to 8000 feet. Based on vitrinite reflectance measurements, there is a weak (5-10 C average) paleothermal anomaly along nearly the entire fault, rising to as much as 50 C in at least one location
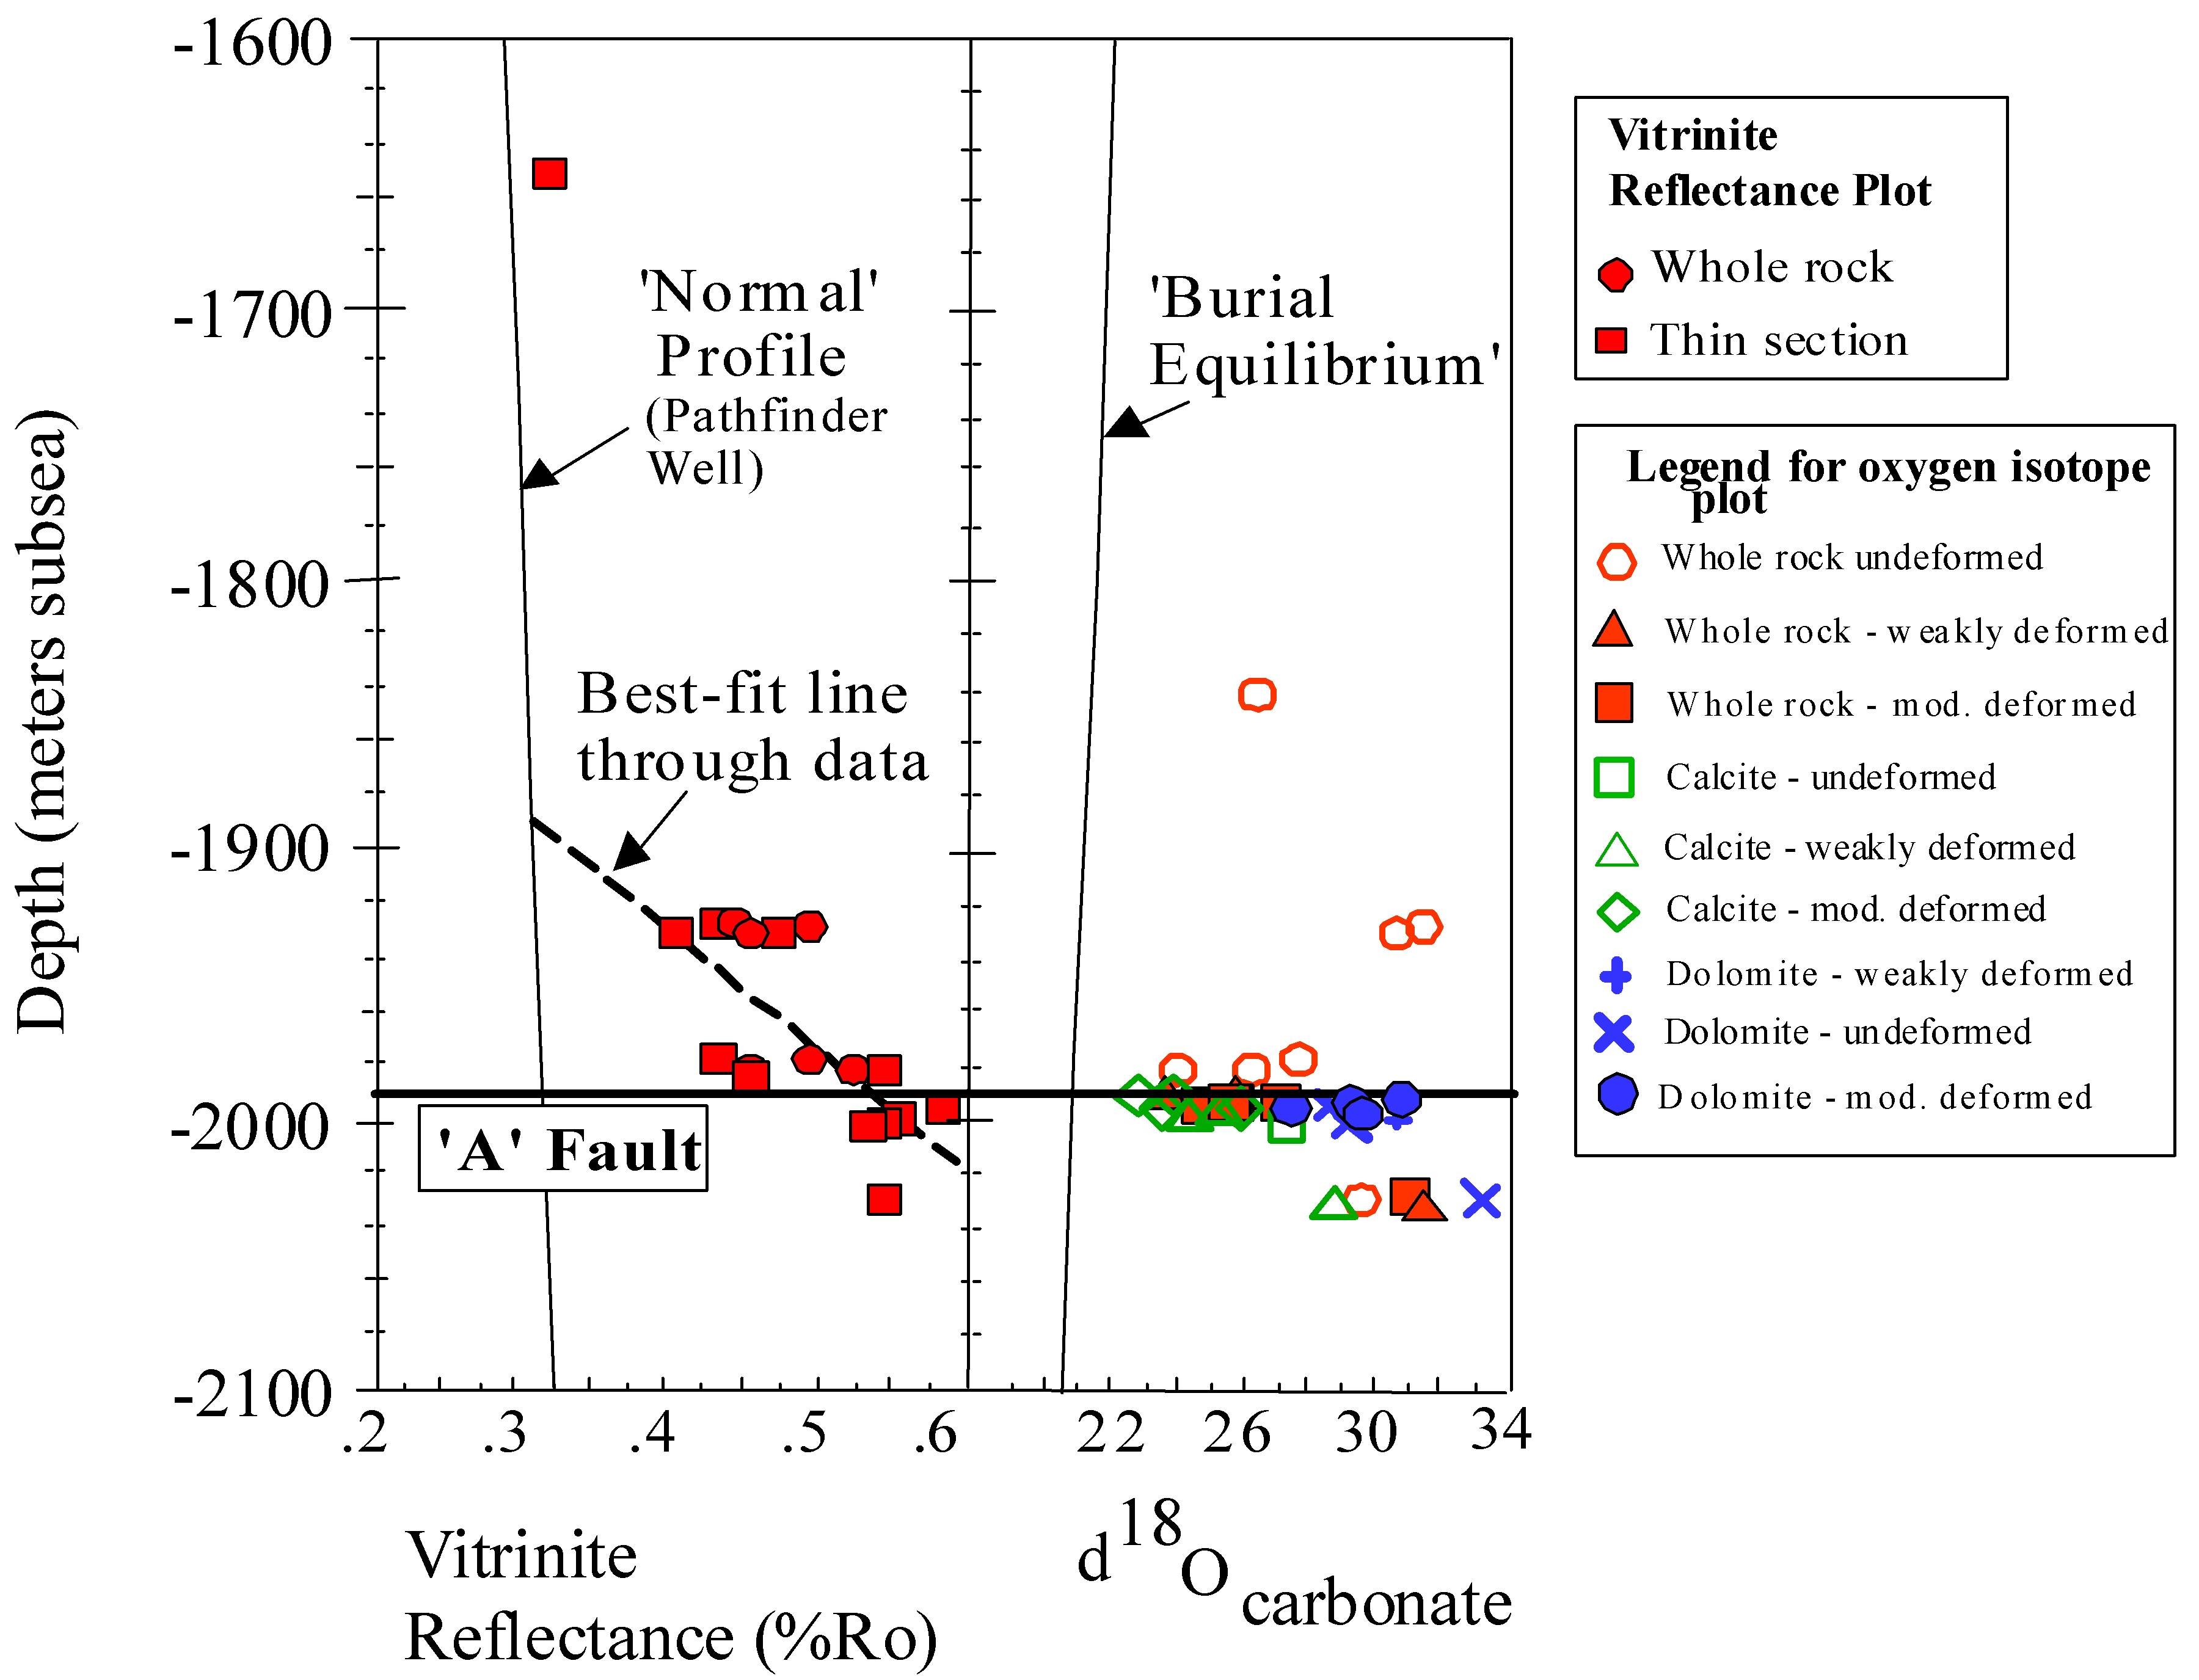
Figure 2. A6ST well, vitrinite reflectance and d18Ocarbonate (SMOW scale) versus depth. The ‘A’ Fault zone extends from the depth shown (1990 m) downward for at least 60 meters. Carbonate d13C values decrease with d18O, pointing to the involvement of a relatively low-d13C fluid (-8 to –10 permil PDB) in the fault.
Simple modeling indicates that the vitrinite reflectance anomaly in the A6ST well, shown in Figure 2, reflects a high-temperature pulse of fluid, perhaps 50 C hotter than ambient temperature. The width of the vitrinite reflectance anomaly, 70 meters perpendicular to the fault, constrains the temperature pulse to last about 150 years. The temperature anomaly could have been produced by a 13-million barrel pulse of hot fluid that traveled up the fault at a Darcy velocity of ~330 m/yr. To transmit this fluid under realistic conditions requires the fault, which comprises shale gouge, to have had a permeability of about 110 milliDarcy during the flow event. Lower, but still elevated, permeability is required to account for the smaller paleothermal anomalies shown in Figure 1. These high permeabilities contrast with the ~100 nanoDarcy fault and shale permeabilities measured at ambient fluid pressure by Stump (1998 M.S.) and Elliot (1999 M.S.).
In contrast to the ‘A’ fault acting as a fluid conduit in the A6ST well, there is no geochemical or paleothermal evidence that the same fault transmitted significant amounts of hot fluid in the Pathfinder well. Thus, the fault is highly variable as a fluid conduit in both space and time. The A6ST well intersected the ‘A’ fault at a branch line with a hangingwall splay. This structural complexity may explain the elevated permeability in the fault zone at the A6ST well.
Fluid pressure measurements and proxies (gas cut drilling mud) show that the ‘A’ Fault is a profound lateral fluid pressure discontinuity (Figure 3). Fluid pressure differs by as much as 1800 psi across the fault, and in the A10ST well (Figure 3 inset) fluid pressure drops by ~800 psi from the ‘A’ Fault to the hangingwall over a lateral distance of about 60 feet.
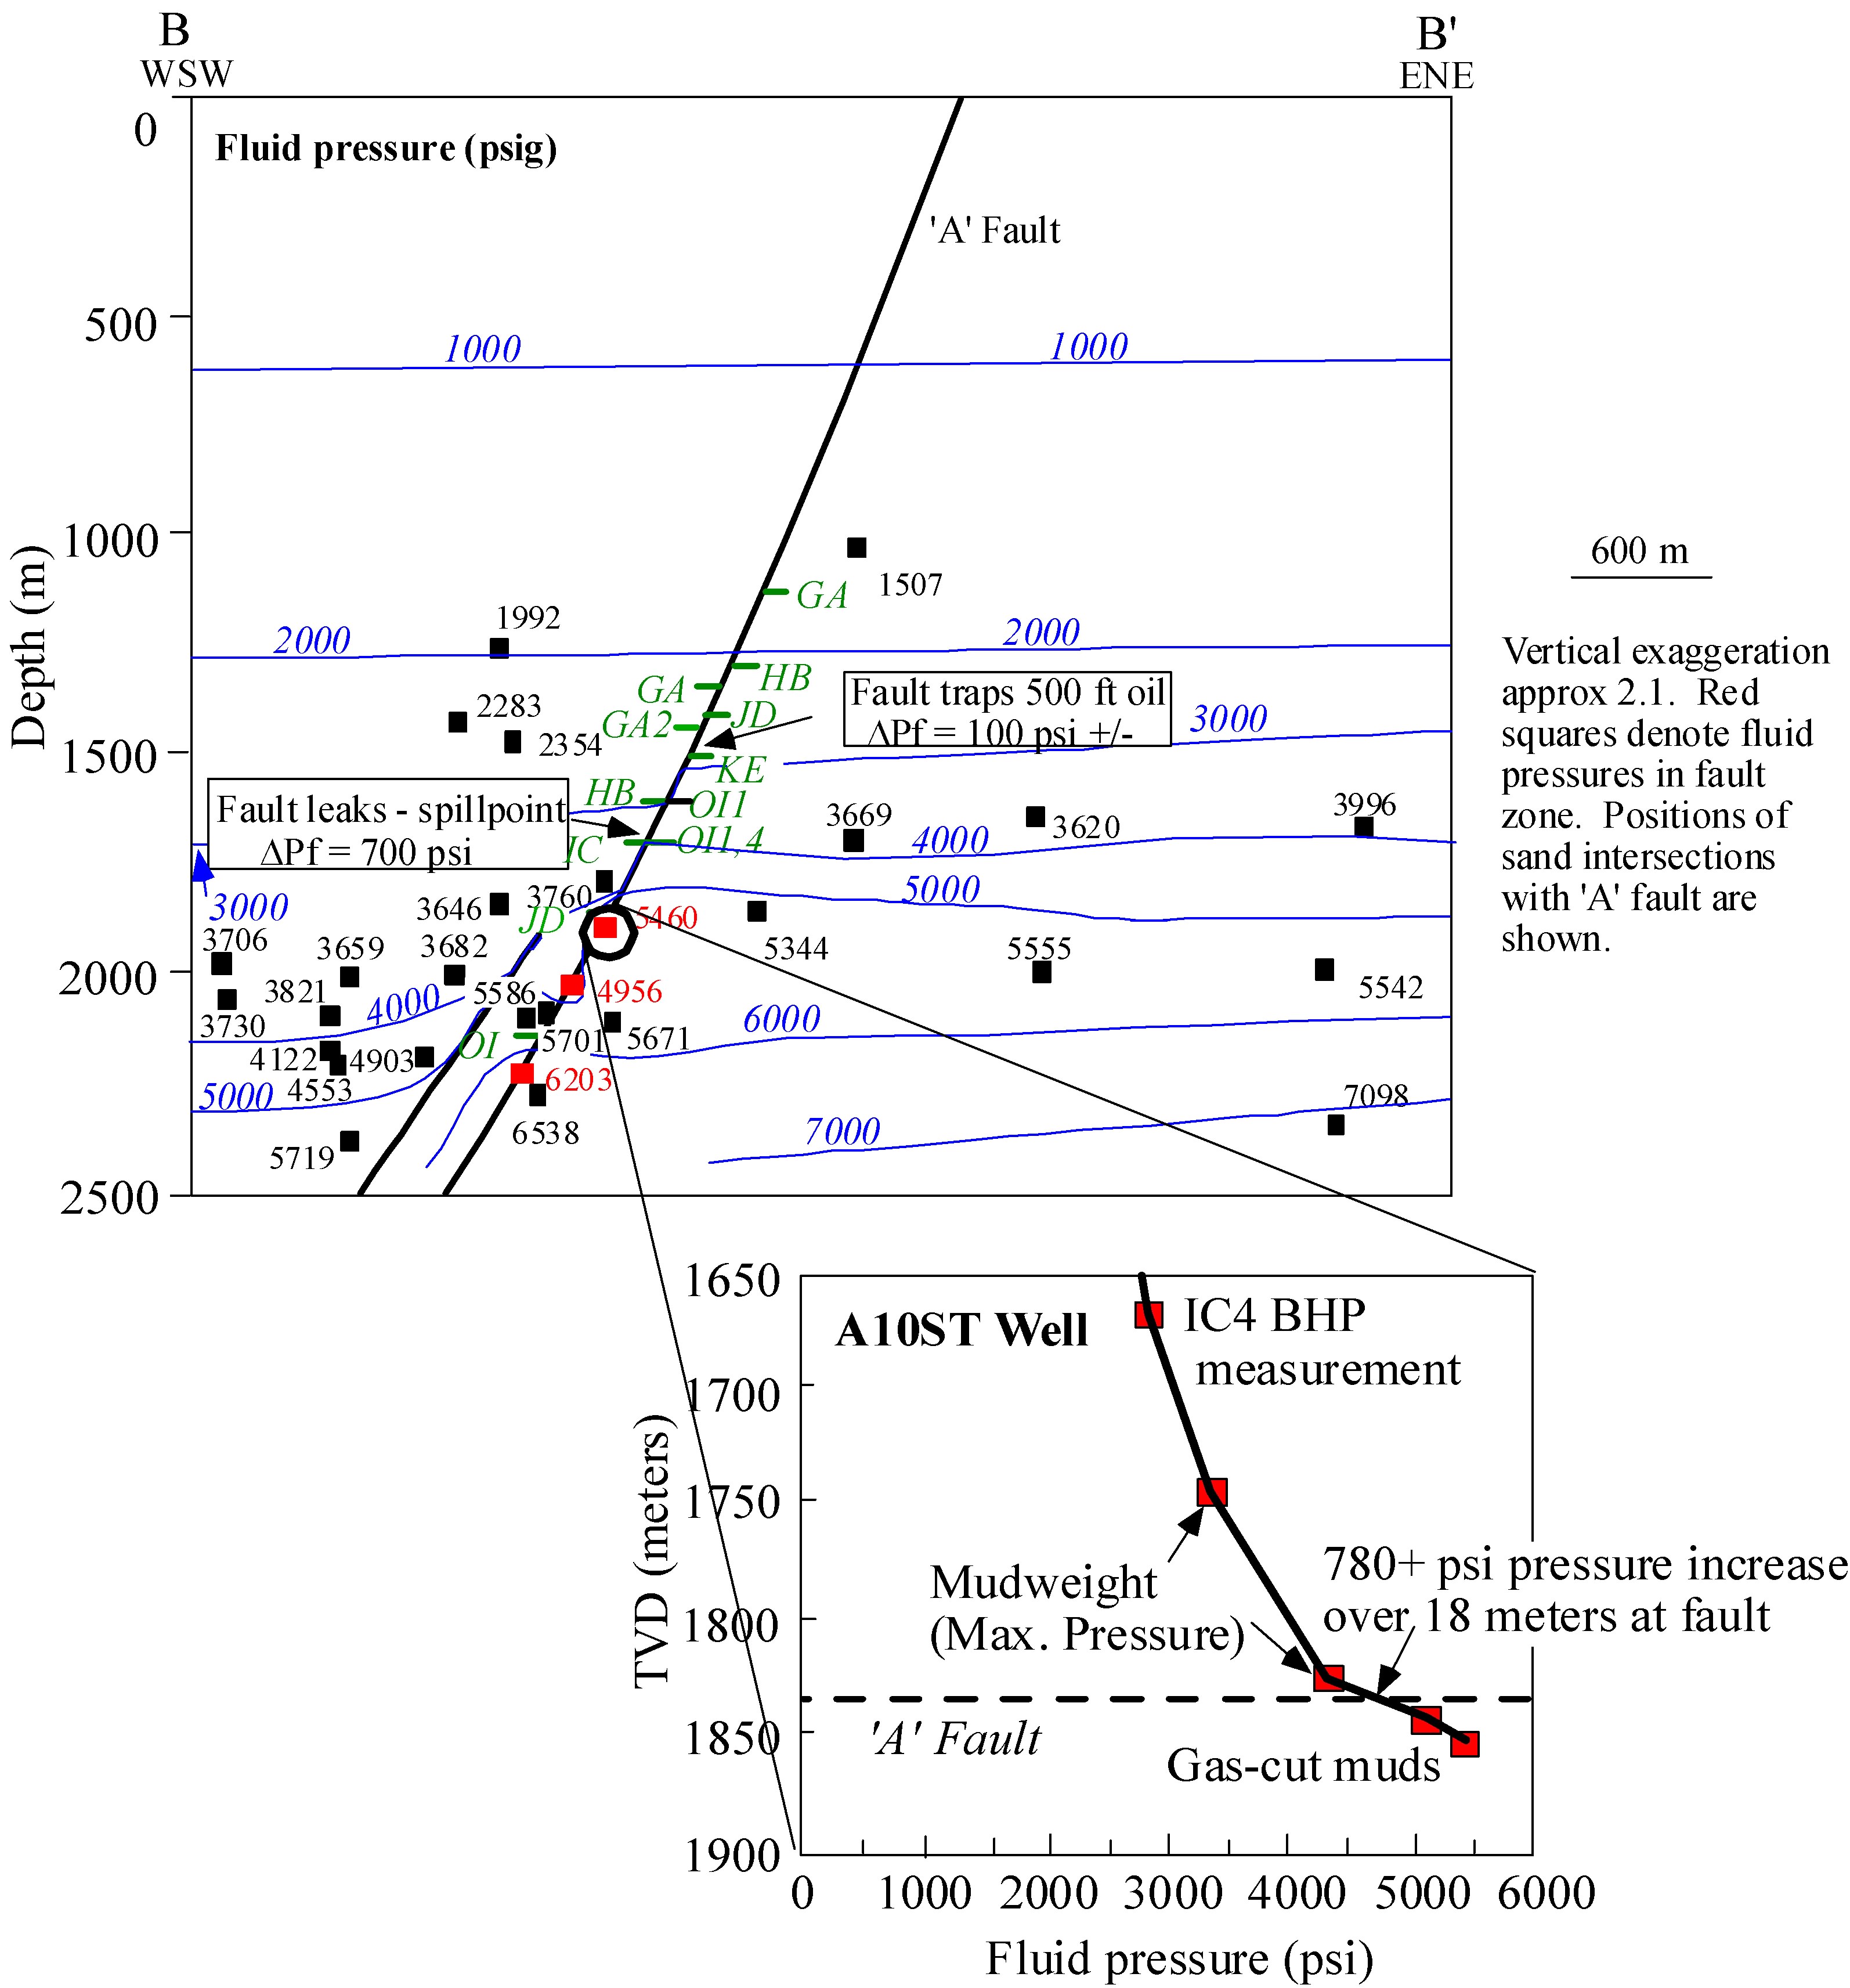
Figure 3. SW-NE cross section through SEI Block 330, showing fluid pressure (psi) from static BHP measurements (downthrown side) and gas-cut muds (upthrown side). The fault leaks oil and gas from the upthrown OI1 and OI4 sands into the downthrown IC sand, at a water pressure differential of 700 psi across the fault. However, the gouge bounding the fault zone is sufficiently impermeable to support a 13 psi/ft (minimum) water pressure gradient in the A10ST well. Fluid pressure in the fault is similar to that in the upthrown side. Ambient effective stress in the ‘A’ Fault is at least 3 Mpa, except for the extremely high-pressured A10ST well, where it is 1.1 Mpa.
Fault gouge permeability (Figure 4) has been calculated for Block 330 faults on the basis of capillary pressure differentials illustrated on fault plane maps. These permeabilities are consistent with those computed for other faults from the literature (Yielding et al., 1997 AAPG Bull.), some of which are shown in Figure 4. Permeability perpendicular to the fault is on the order of 5 – 20 nanoDarcy, somewhat lower than the 60-110 nD permeability measured for undeformed Block 330 mudstones (Stump, 1998; Elliot, 1999).
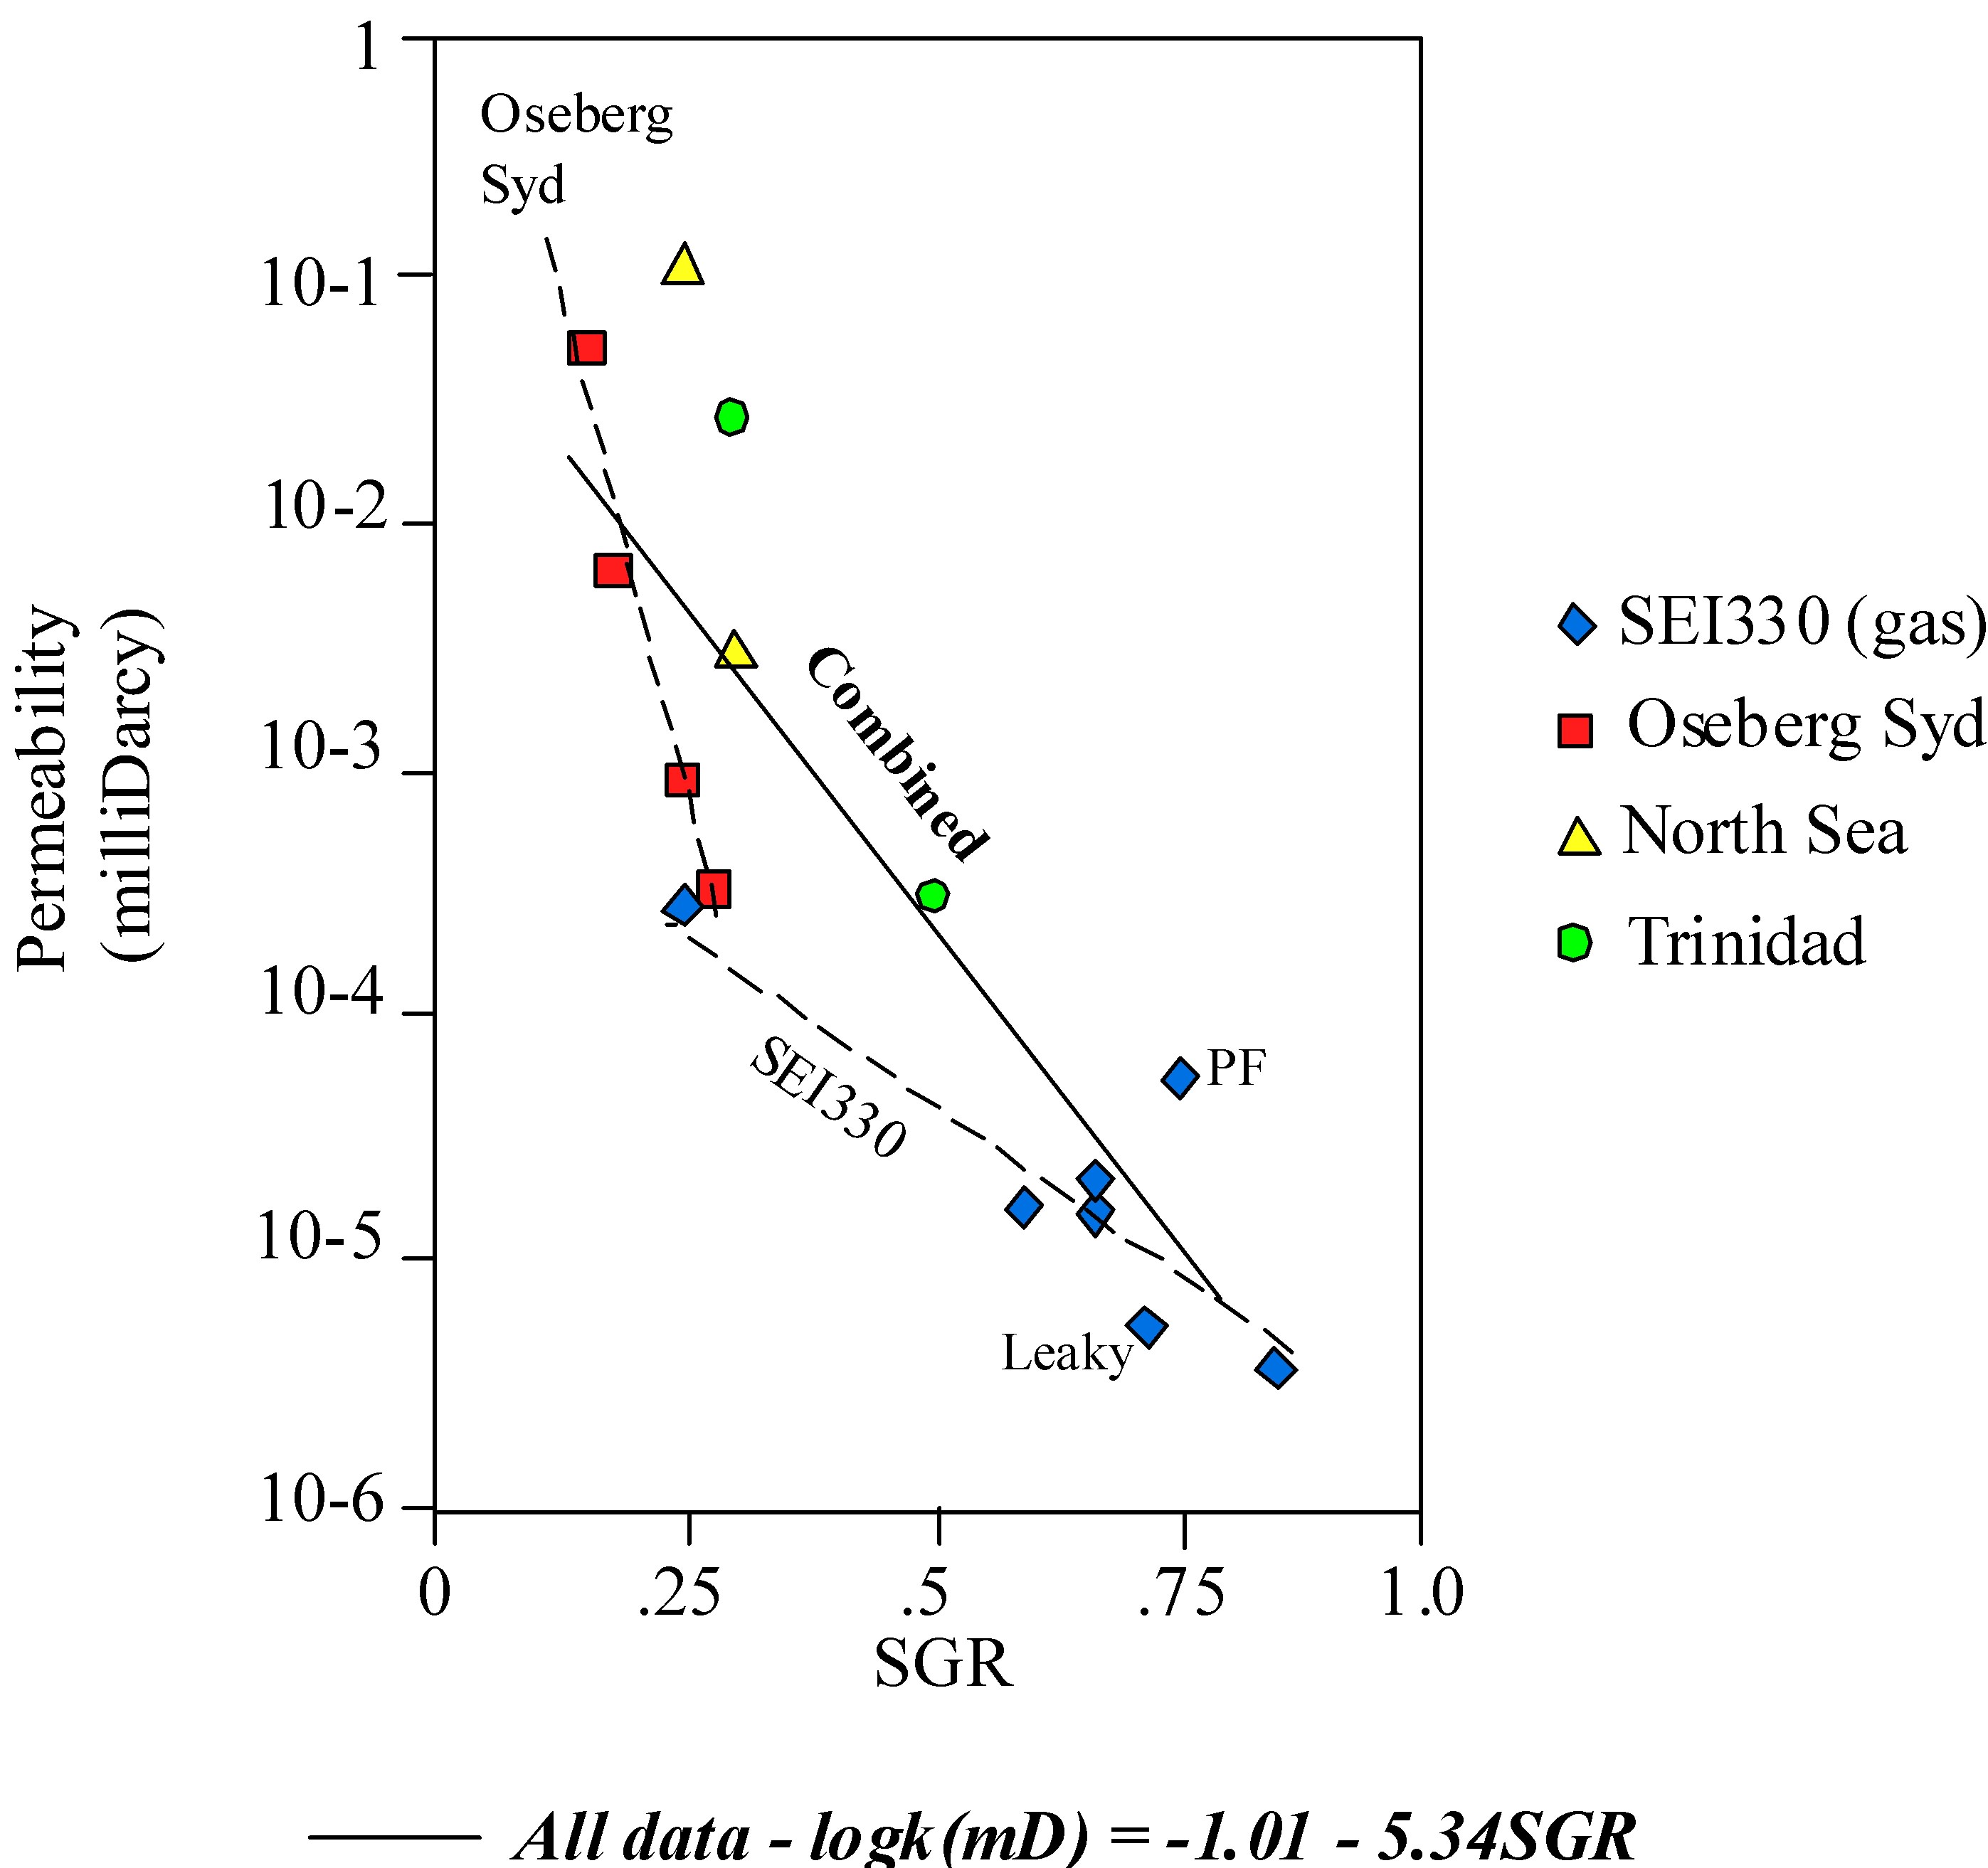
Figure 4. Permeability versus shale gouge ratio (SGR) for faults in Block 330 and other locations documented by Yielding et al. (1997). SGR is the thickness of shale in the offset section divided by the fault throw. Permeability was based on the capillary seal capacity of the fault determined from hydrocarbon juxtapositions in the field or from capillary entry pressure measurements of fault gouge (Pathfinder ‘PF’ and A6ST wells). Different areas may be characterized by different k-SGR relationships, as shown.
For the reservoir fluid volume to have migrated along the known fault system in the required time and at known buoyancy and potentiometric pressure gradients, average fault permeability must be orders of magnitude higher than what is observed in the laboratory or indicated by large lateral fluid pressure gradients associated with faults in the field. In the case of the SEI330 field, the filling of reservoirs with 1.6*109 m3 fluid (from 20km2 area x 300 m sand thickness x 0.25 porosity) in 120,000 years (Losh et al., 2002), given fault geometry of 4 meters wide by 10 km long, requires a Darcy fluid flux of 0.4 m/yr. At an excess pressure gradient of 50 bars/km (lithostatic), an average fault permeability of 2.5 mD would be required to accommodate this flow rate. Lower excess pressure gradients require even higher permeability to account for the calculated flux.
Permeability of the ‘A’ Fault gouge is strongly dependent on effective stress. Elliot (1999) showed that the gouge has 100 milliDarcy permeability at zero effective stress, decreasing to ambient permeability of ~100 nanoDarcy at 3 Mpa effective stress. Thus, the fault would have to be at constant ambient effective stress of less than 1 Mpa to have the high permeability required to account for the flux of fluid into the reservoirs. As shown in Figure 5, however, the ambient effective stress in the fault zone at the level of the reservoir section is generally at least 3 Mpa, not nearly low enough to support enhanced fracture flow. This corroborates the observation, based on the Pathfinder core, that the fluid pressure was never high enough (or the effective stress low enough) to cause the fractures to have elevated permeability at the level of the reservoirs, at least in some portions of the fault.
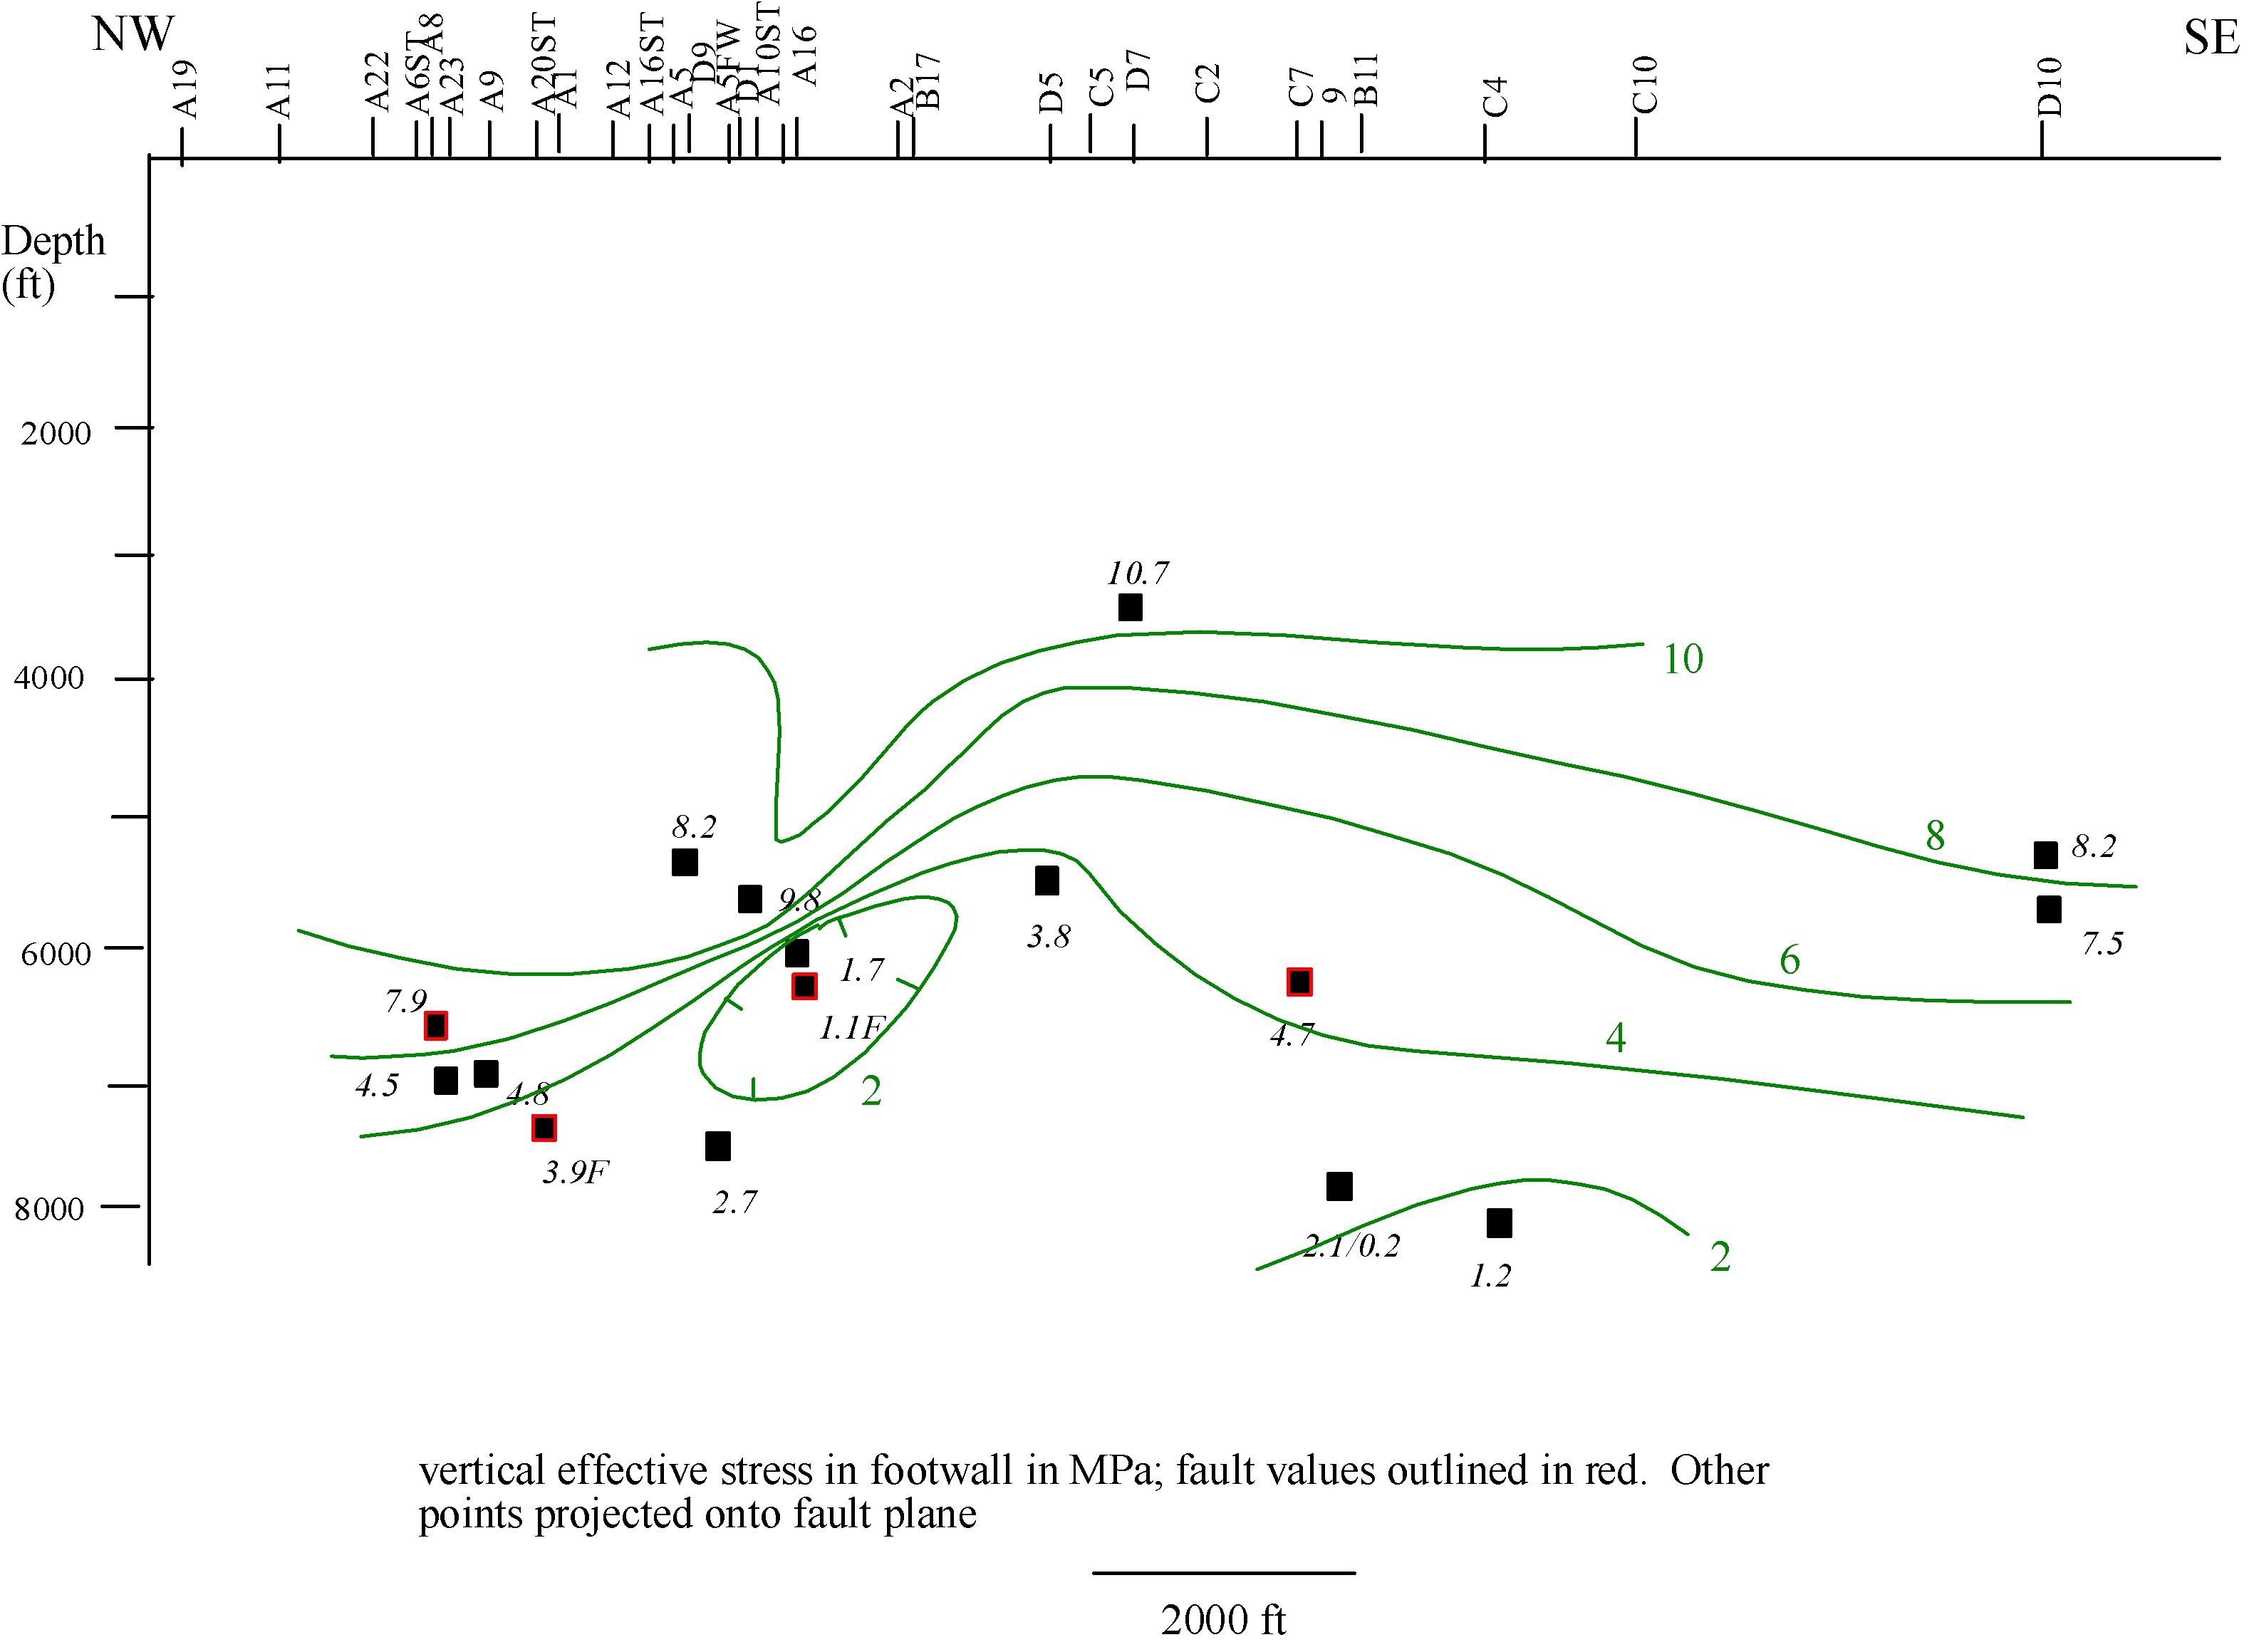
Figure 5. Vertical effective stress, ‘A’ Fault plane, Block 330. Points outlined in red are in the fault zone, others are projected various distances to the fault from the upthrown side. Fluid pressures were based on the mudweight that was cut by gas averaged with the mudweight that was required to suppress the gas kick. The A10ST well (Sv = 1.1 Mpa) intersects a transient fluid pulse in the fault (discussed below); otherwise, the fault is essentially at the same effective stress as the upthrown sediments at the same depth. Based on experimental work of Elliot (1999), the fault in the A10ST well has a permeability of about 1 milliDarcy.
The fault eructation event, or When Faults Burp.
We captured in real time, for the first time ever, evidence of the movement of a high-pressure fluid pulse in a fault by means of seismic reflection data. Two 3D seismic reflection surveys made 7 years apart (1985 and 1992) over the same area at SEI Block 330 were dip-filtered parallel to the plane of the main growth fault, the ‘A’ Fault. The data clearly show the movement of a high-amplitude set of reflectors updip in the fault over a distance of 1 km (Figure 6). Proof that these reflectors correspond to a high-pressure fluid came in an unexpected form when Pennzoil (now Devon Energy) drillers penetrated the fault in the A10ST well in 1992 -right in the middle of the amplitude anomaly (Figure 6b) – and encountered fluids at near-lithostatic pressures. Such pressures are anomalous at these depths, even in the fault zones.
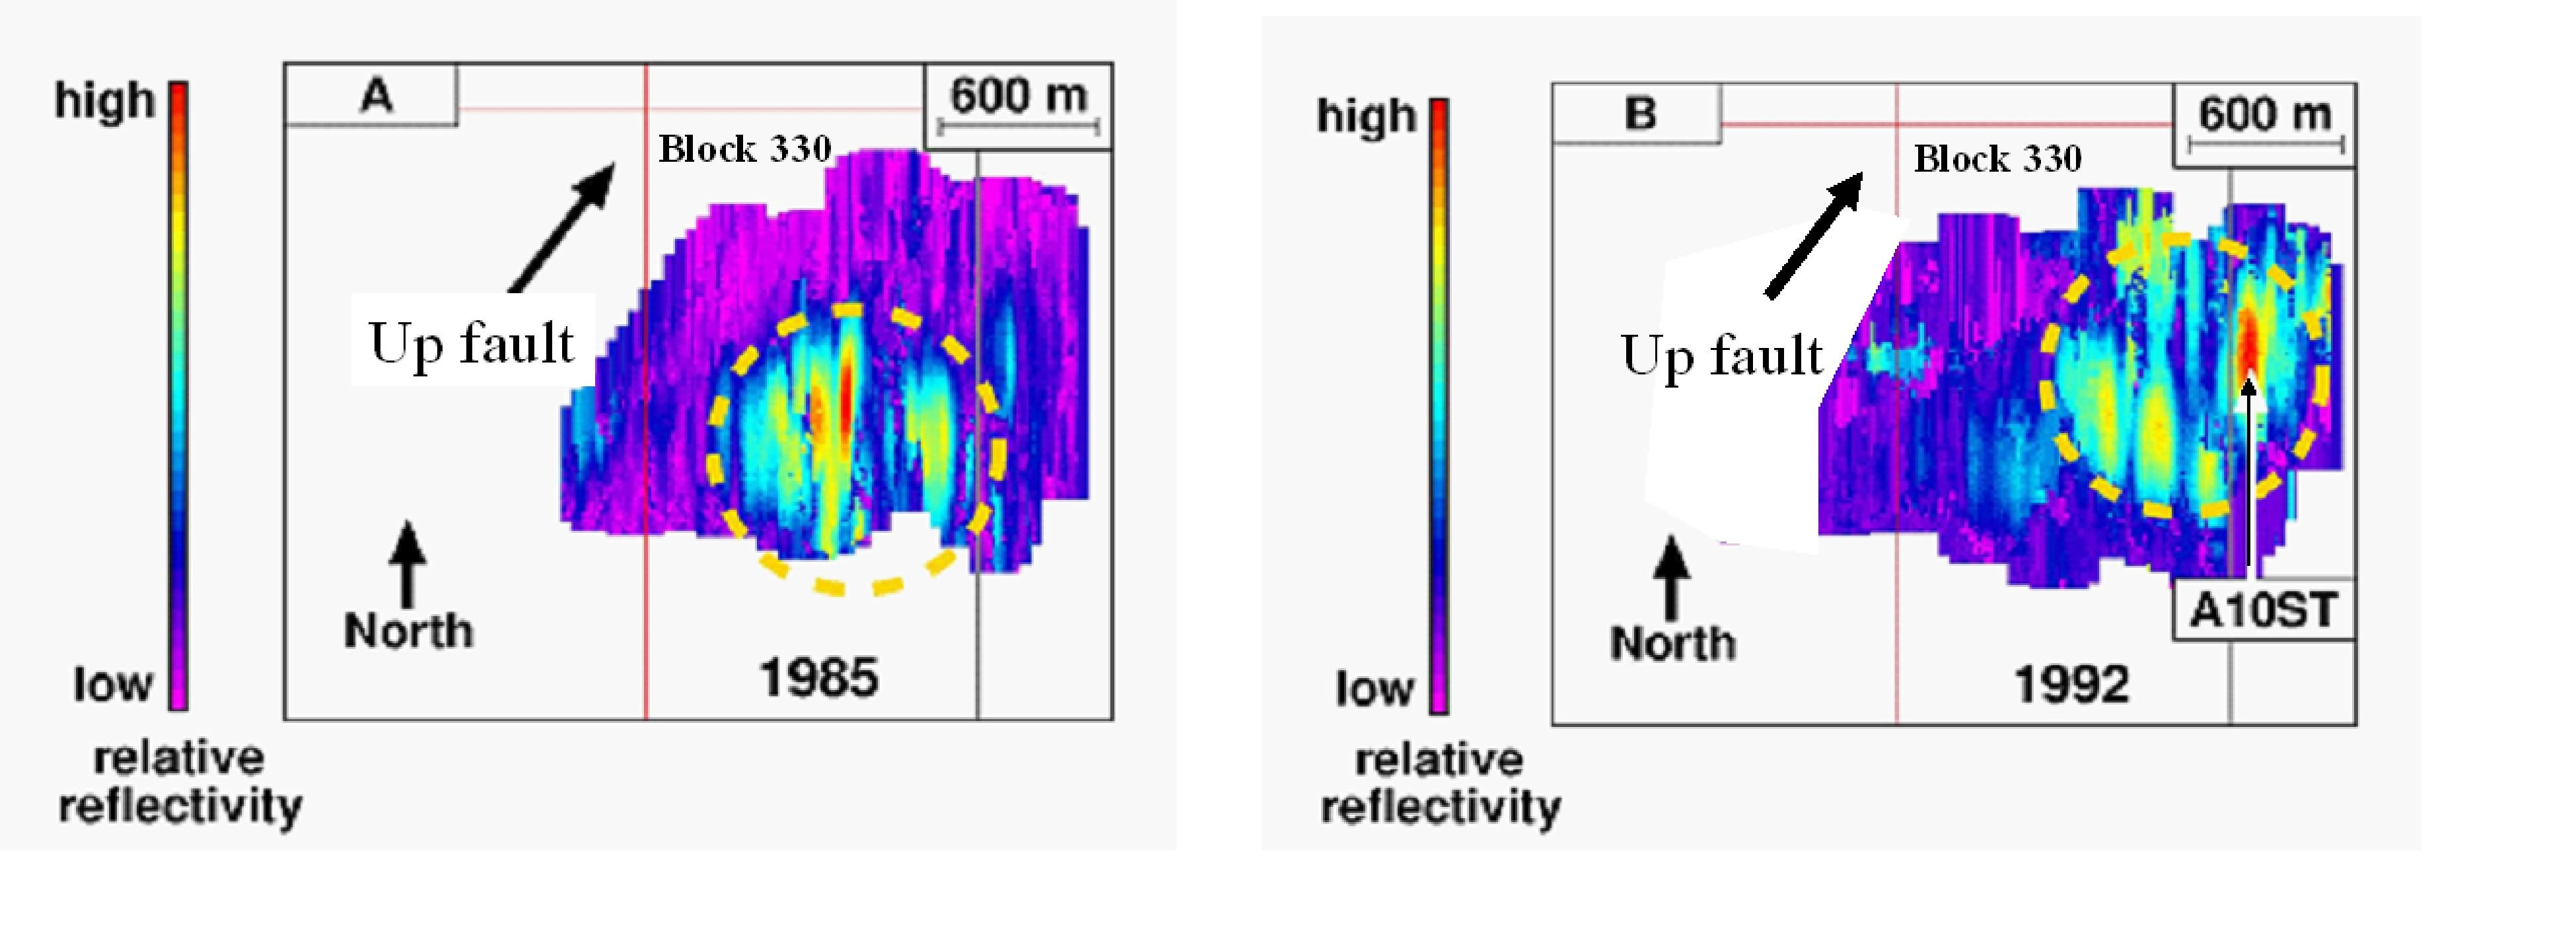
Figure 6. Dip-filtered seismic reflection amplitudes extracted from the ‘A’ fault plane, South Eugene Island Block 330, for two 3D surveys, one in 1985 (A, left) and one in 1992 (B, right). Block boundaries are shown for reference. High-amplitude reflector ‘patch’ has moved in the updip (northeast) direction about 1 km in 7 years. Estimates of porosity based on the strength of amplitude anomaly indicate a total of about 250,000 m3 (1.6 million barrels) of fluid in the ‘burp.’
The fact that effective stress is low enough to elevate fault permeability in the A10ST well, and that fault permeability has been high in the past in the A6ST well, points to lateral heterogeneity of fluid transmissivity in the fault. The Pathfinder well intersected a “cold spot” in the fault, indicating that the fault transmissivity there may be unusually low relative to other parts of the fault. Given that the entire fault has been active, fault activity itself may not be a sufficient cause to promote substantial fluid flow. As noted, structural complexity may play a role in localizing fluid flow in the fault.
How much fluid flowed up the fault?
Fluid flow related to tectonic slip events may be estimated by computing the recurrence of events of a given range of seismic potency (rupture area times displacement; Anderson, et al., 1993 Tectonophysics) on the fault. The recurrence of slip events is constrained by the geologic slip rate on the fault, the size-frequency distribution, and the fault geometry, which places an upper limit on rupture size. By estimating rupture width and fracture porosity, volumes of fluid associated with events of given potency can be computed and summed (Table 1). The slip events are probably aseismic. The fluid need not be lithostatically-pressured to ascend along the fault by this mechanism.
![]()
Table 1. Fluid volumes and flux associated with rupture events on the ‘A’ fault, SEI330. Rupture size-frequency relationship is based on unpublished data.
At the total annual flux of 13,614 m3/yr, the total volume of fluid that would migrate through the fault in the past 120,000 years (the time of filling of the SEI 330 fields determined from distribution of biodegraded vs unbiodegraded oils) is 1.63 x 10⁹ m3. This, by coincidence, is the same volume that is calculated for the reservoir fluid (brine+oil+gas) in the SEI Block 330 Field. The actual volume of fluid transmitted during rupture events is probably much larger, as the slip event only initiates the fracture that can then be held open by high-pressured fluids that drain from deep sand adjacent to the fault. At the same time, fluids may access only part of the fault during whole-fault rupture events; perhaps the two effects nearly cancel each other. The largest events, those that rupture most of the fault plane, account for the bulk of fluid flow. These same ruptures are the most likely to link deep, high-pressured “feeder sands” with the shallower reservoirs.
Some sands are known to have nearly lithostatic fluid pressure in the upthrown side to the ‘A’ Fault. For significant flux in the fault due to low effective stress-enhanced permeability, the effective stress must be very low throughout the fault conduit. However, at the level of the reservoirs, the fault is not generally at very low effective stress, indicating that ambient flux in the fault is generally very low, and that flux in the fault is elevated only periodically. The top of very low effective stress in the fault lies not far below the base of the reservoir section, indicating there is a “choke point” in the fault that may be controlled by the lithology of adjacent sediment.
In deep, near-lithostatically pressured sediments, fluids may be able to enter the fault without the aid of slip events, but they appear to require these events to ascend to the level of the reservoirs. Near-lithostatic fluid pressure deep in the fault may facilitate slip events, which then propagate into the lower-pressured portion of the fault at the depth of the reservoir sands. Thus, there is probably a cycle that involves fluid pressure buildup, tectonic slip, fluid transport, and ultimately, draining of the fault.
Fluid pulses ascend the fault periodically, and escape into adjacent sand that is at lower pressure than the fault zone itself. A calcite-cemented zone in downthrown sands adjacent to the fault (Losh et al., AAPG Bull. 1999) gives evidence of the pressure drop experienced by fluids that escape from the fault, as calcite solubility decreases with decreasing pressure. The low-permeability gouge that bounds the fault zone is made permeable by the combination of tectonic slip that opens up fractures in the gouge and associated splay faults, and by the transfer of pressure by the fluid pulse itself, that enhances permeability in the vicinity of the pulse. Once the fluid pulse is discharged into the sand, fractures in the fault zone close, gouge permeability drops to nanoDarcy levels, and fluid pressure in the fault builds. This pressure, combined with the low gouge permeability, acts to prevent hydrocarbons from re-entering the fault from the downthrown reservoirs.
At the same time, reservoir fluid pressure does not appear to promote shear failure, as was postulated for the overpressured OI reservoir by Finkbeiner et al. (2001, AAPG Bull.). Their analysis was based on the assumption of an ambient fluid pressure discontinuity between reservoir sand and overlying shale. It is conceivable that, on the timescale of fluid injection from the fault into the reservoir, a transient pressure discontinuity sufficient to allow shear failure could develop, but it would relax over a timescale of years. In any event, no leakage of oil from the OI sand to shallower reservoirs is evidenced from geochemical data, implying that fluid-pressure driven shear failure in the downthrown reservoir section probably has not occurred.
Thus the fault acts as a “one-way valve” from deep accumulations to shallower reservoirs.