
P. Meulbroek, L. Cathles, and J. Whelan, 1998, Org. Geochem., v. 29, pp. 223-239; S. Losh, L. Cathles, and P. Meulbroek, 2002, Org. Geochem. v. 33, pp. 655-663; P. Meulbroek, 2002, Org. Geochem., v. 33. pp 613-634; S. Losh, L. Cathles, 2003, Gas Research Institute CD-ROM, vol. 4, 71 pp.; Losh, S., Swart, D., Dickinson, A., 2009, Transactions of Gulf Coast Association of Geological Societies, v. 59, pp. 477-485; Losh, S., Cathles, L., 2010, Marine Petrol. Geol. v. 27, pp. 467-475
Oil and gas commonly interact with one another in the subsurface. Gas can mix with oil, equilibrate with it, and then separate from it, altering the chemistry of both liquid and vapor. This process is called “gas washing.”
Gas washing leaves a characteristic signature in the residual oil composition: an exponentially-increasing depletion of n-alkanes with decreasing carbon number below a threshold “break” number, as shown in Figure 1. The “break number” tracks the heaviest n-alkane that has been stripped from the oil, and largely reflects the pressure at which gas washing took place. The mass depletion of n-alkanes in gas-washed oil relative to its unfractionated parent can be calculated using the method of Losh et al. (2002, Org. Geochem.). Biodegradation and water washing are ruled out for gas-washed oils on the basis of ratios of compounds having similar molecular weight but different structure; e.g., aromatics, isoprenoids, and n-alkanes.
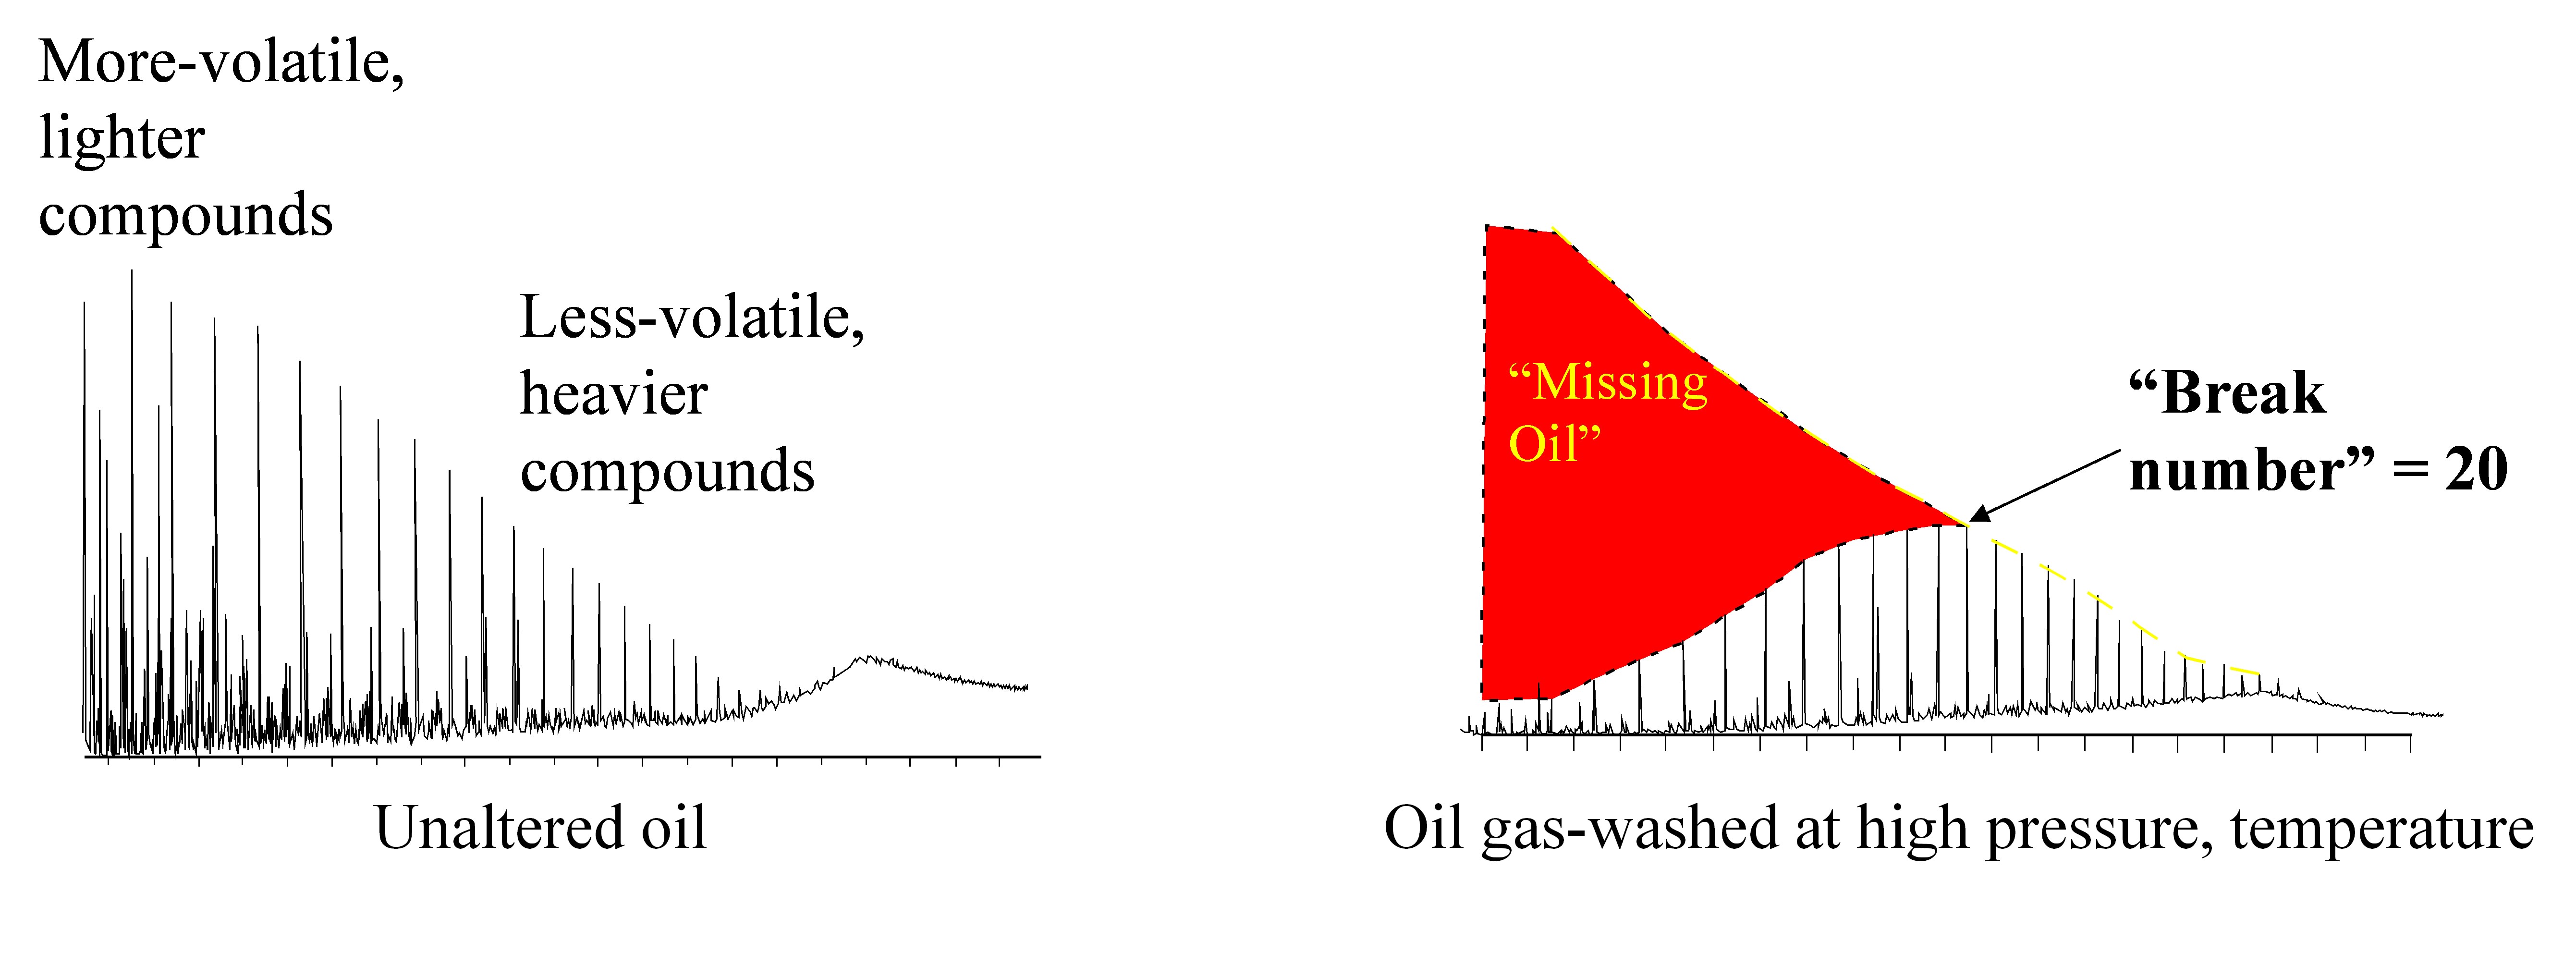
Figure 1. Gas chromatogram of gas-washed oil (left) compared with unaltered oil (right). Vertical scale is normalized to the most-abundant peak in the oil. The shaded area is the “missing oil” removed by gas washing. The gas-washed oil “break number” is 20, as nC20 is the lightest n-alkane not fractionated into the vapor phase. The predominance of light aromatics (toluene, xylenes) over n-alkanes of the same carbon number precludes significant water washing. The very low nC20/”hump” and low pristane/nC17 ratio in the gas-washed oil both indicate the oil is not biodegraded.
Gas washing has been described in various forms in the literature. Most notably, Thompson (1987 Mar. Petrol. Geol.) described a process that he called ‘evaporative fractionation,’ and farther back, Silverman (1965, AAPG Mem. 4) documented ‘migration fractionation.’ However, at Cornell, we have both discovered that gas washing in the Gulf of Mexico is widespread and profound, and that the Pressure-Temperature-Composition conditions of phase separation can be calculated from equation of state/phase equilibria modeling. This modeling, combined with geologic reconstruction, can pinpoint the present–day depth of sand in which gas washing took place during hydrocarbon migration.
Simple gas chromatographic data can be used to compute the amount of n-alkanes lost to gas washing. Kissin (1987) noted that normal, mature oils are typified by exponentially decreasing abundance of n-alkanes with increasing carbon number. When transformed to logarithm of abundance (e.g. in terms of mole fraction) and plotted against n-alkane carbon number, n-alkane abundance data for a normal unfractionated oil plots as a straight line (Figure 2). Gas washing is evident as a regular departure from the log-linear fit at relatively low carbon number, seen as the curved trend on Figure 2. This departure is the basis for computing n-alkane mass depletion.
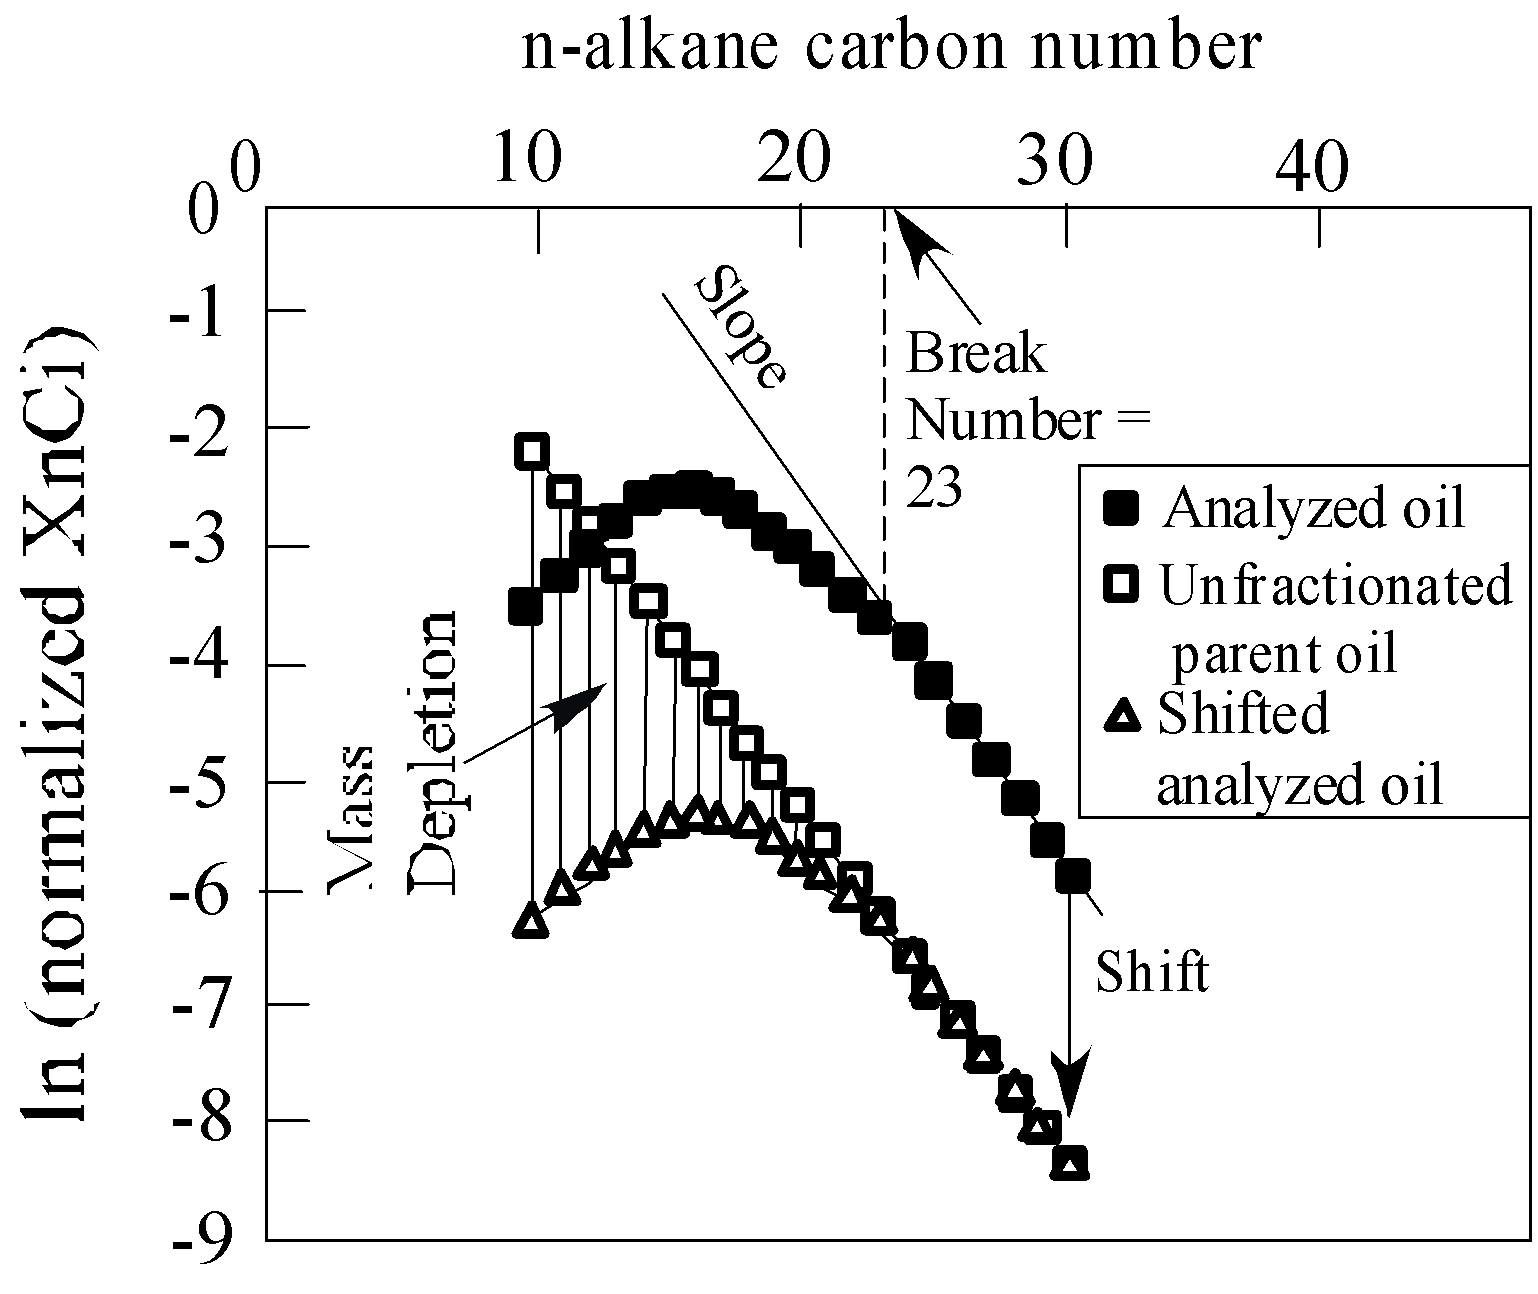
Figure 2. “Molar fraction plot,” showing linear trend of n-alkane data from unfractionated oil (hollow squares), contrasted with n-alkane depleted oil (filled squares), shifted (triangles) to show comparison with the unfractionated oil. Mass depletion is calculated by difference between the two.
Gas washing has removed up to 90 weight % of the C10+ n-alkanes from oils near the Louisiana shoreline (Figure 3). There is a remarkable gradient in maximum n-alkane depletion with distance from shore: oils from the Jolliet field 120 miles offshore show no gas washing. Equation of state modeling shows that Tiger Shoals oils (location shown in Figure 3) were gas washed at pressures of about 10,000 psi by 4 moles of gas per mole of oil (subsurface volume gas:oil ratio of about 1.3:1). Oils from SEI330 were washed at about 6200 psi by ~15 moles gas:mole oil: they’re much less altered than the Tiger Shoals oils, despite the higher ratio of washing gas to oil, because of the lower pressure of gas washing at SEI 330.
As shown below, gas washing probably took place predominantly in sands through which oil and gas migrated on their way to their present reservoirs or the surface.
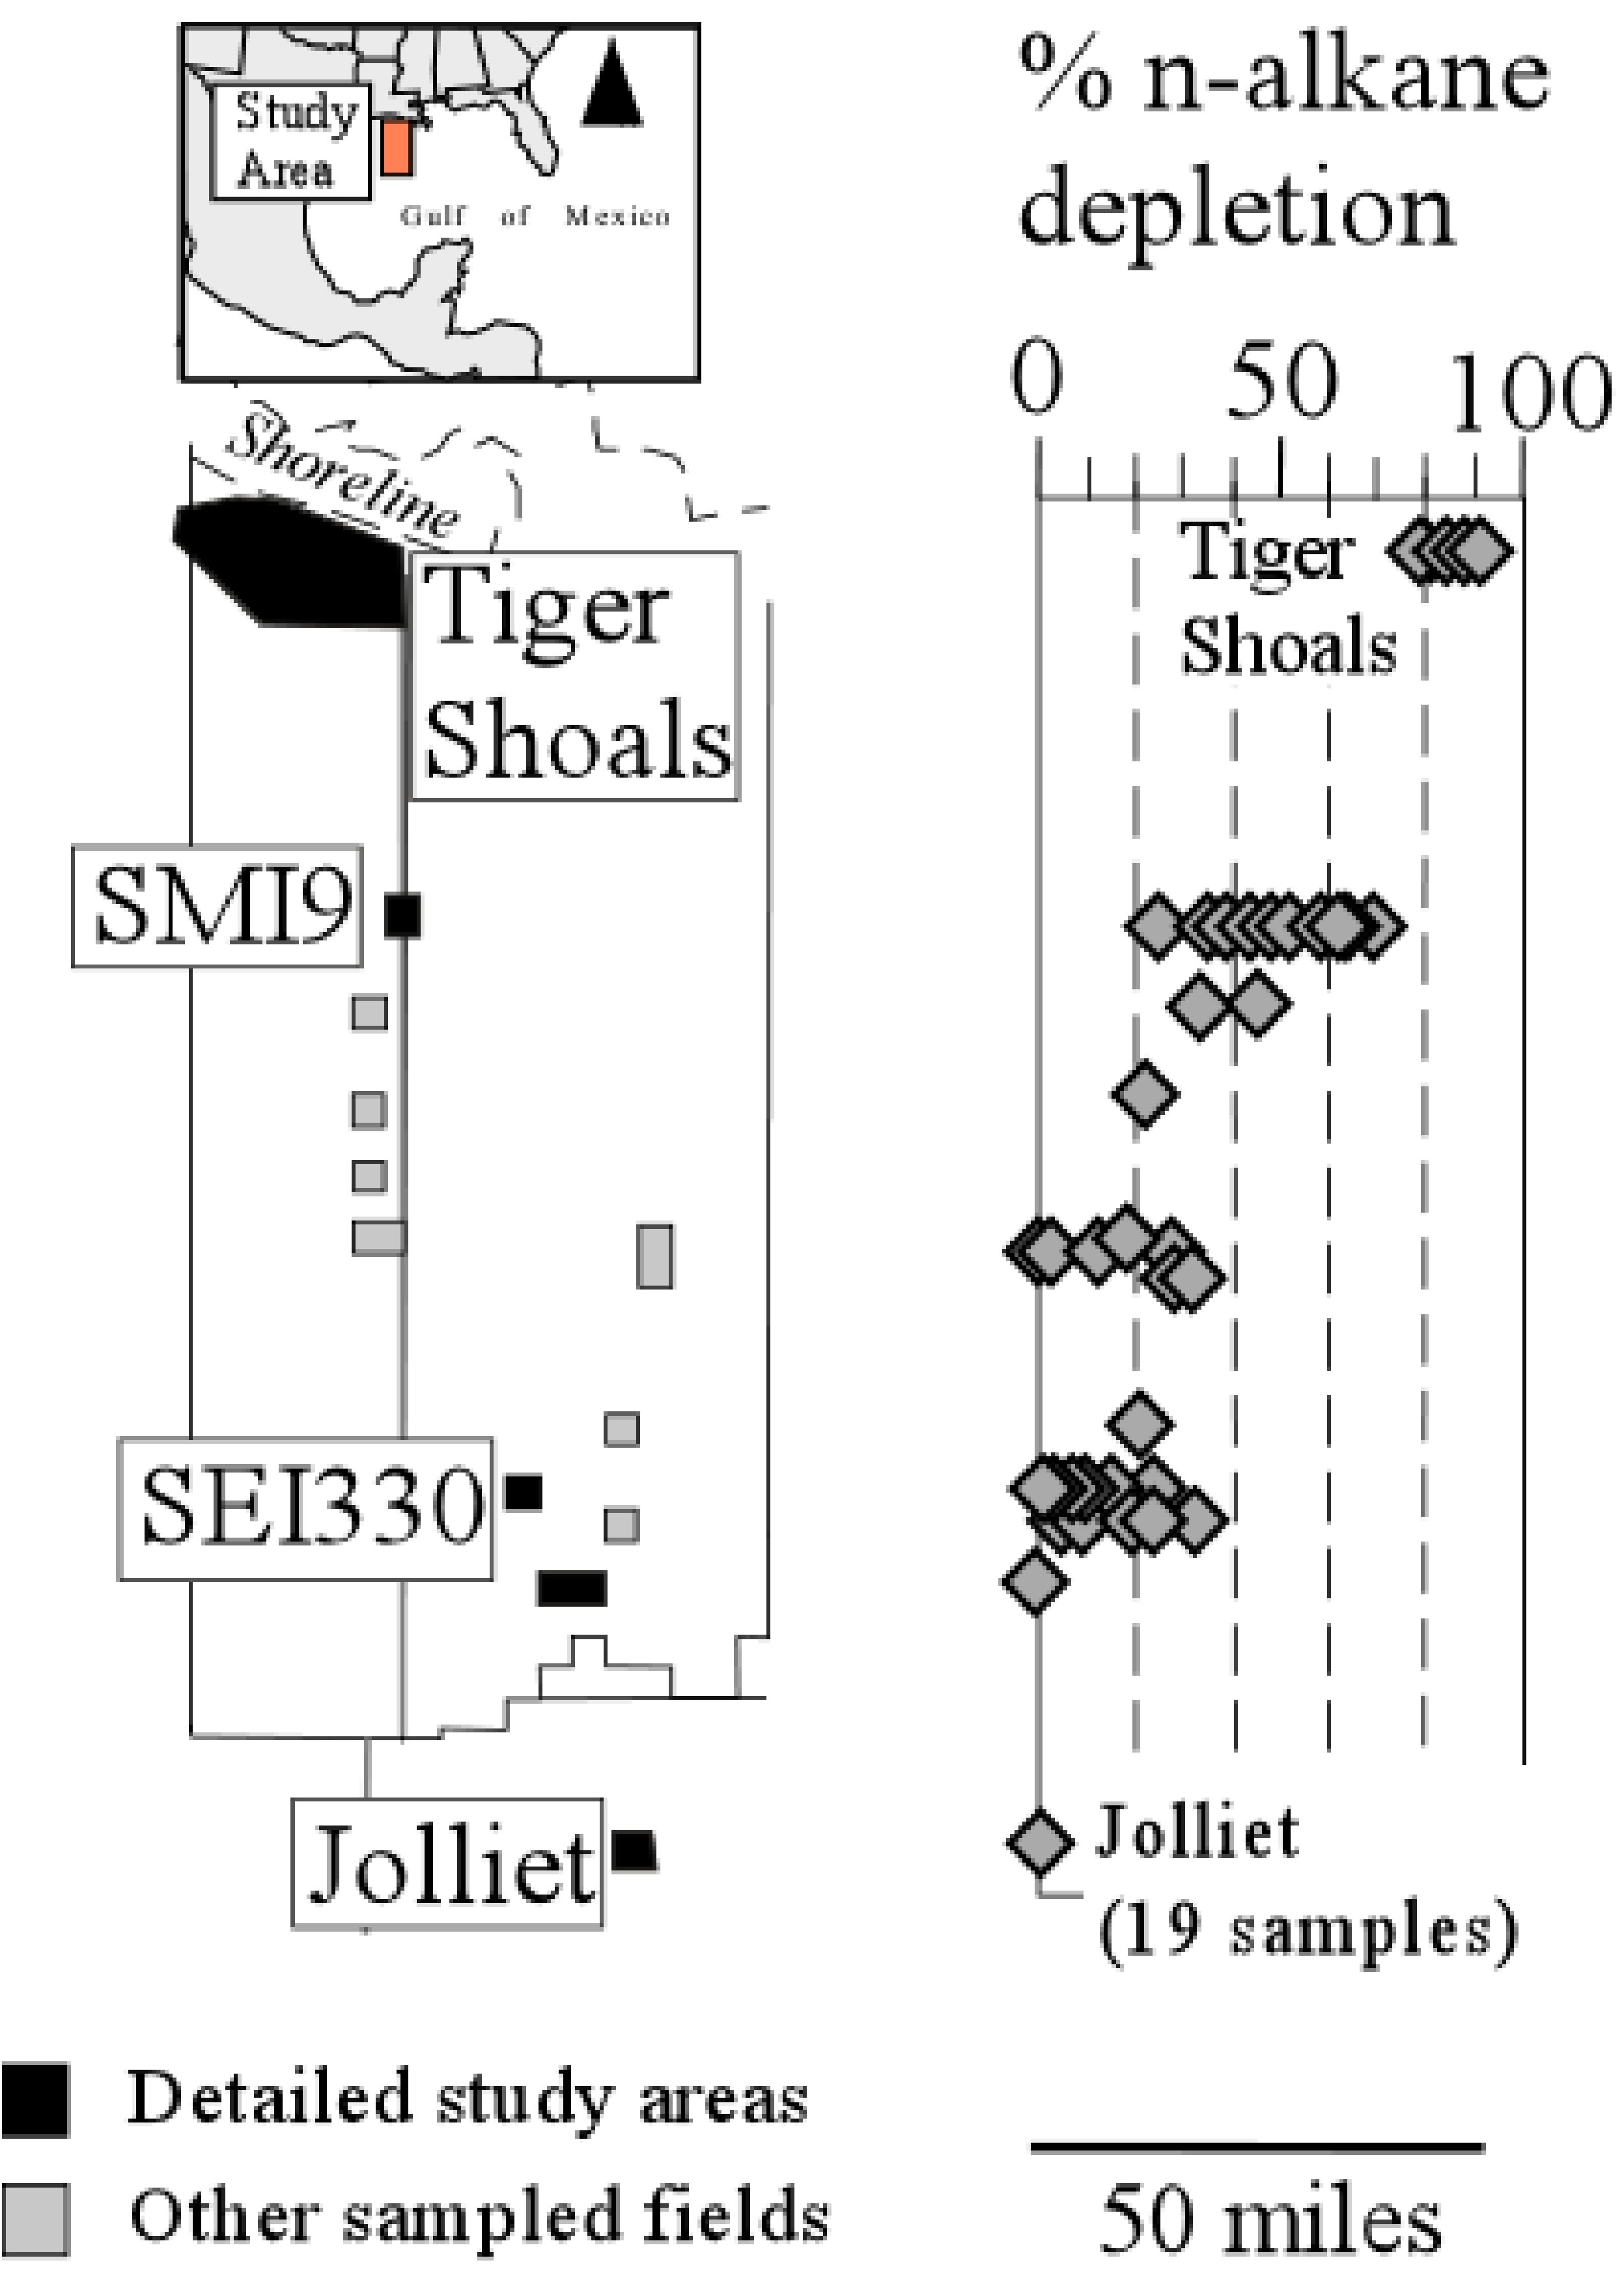
Figure 3. Location of the Louisiana corridor in South Marsh Island, Eugene Island, and Green Canyon OCS lease areas, offshore Louisiana (left). The weight percent C10+ n-alkane depletion decreases regularly with distance from shore (plot on right).
Further work with an MSU undergraduate, analyzing samples provided by ChevronTexaco, expanded the sample base to a wider swath of the continental shelf offshore Louisiana (Figure 4). The general trend of decreasing gas washing with distance from shore holds but is somewhat modified by the additional samples. Overall, extent of gas washing decreases in a southeasterly direction from Tiger Shoals in the northwest corner of the transect area.
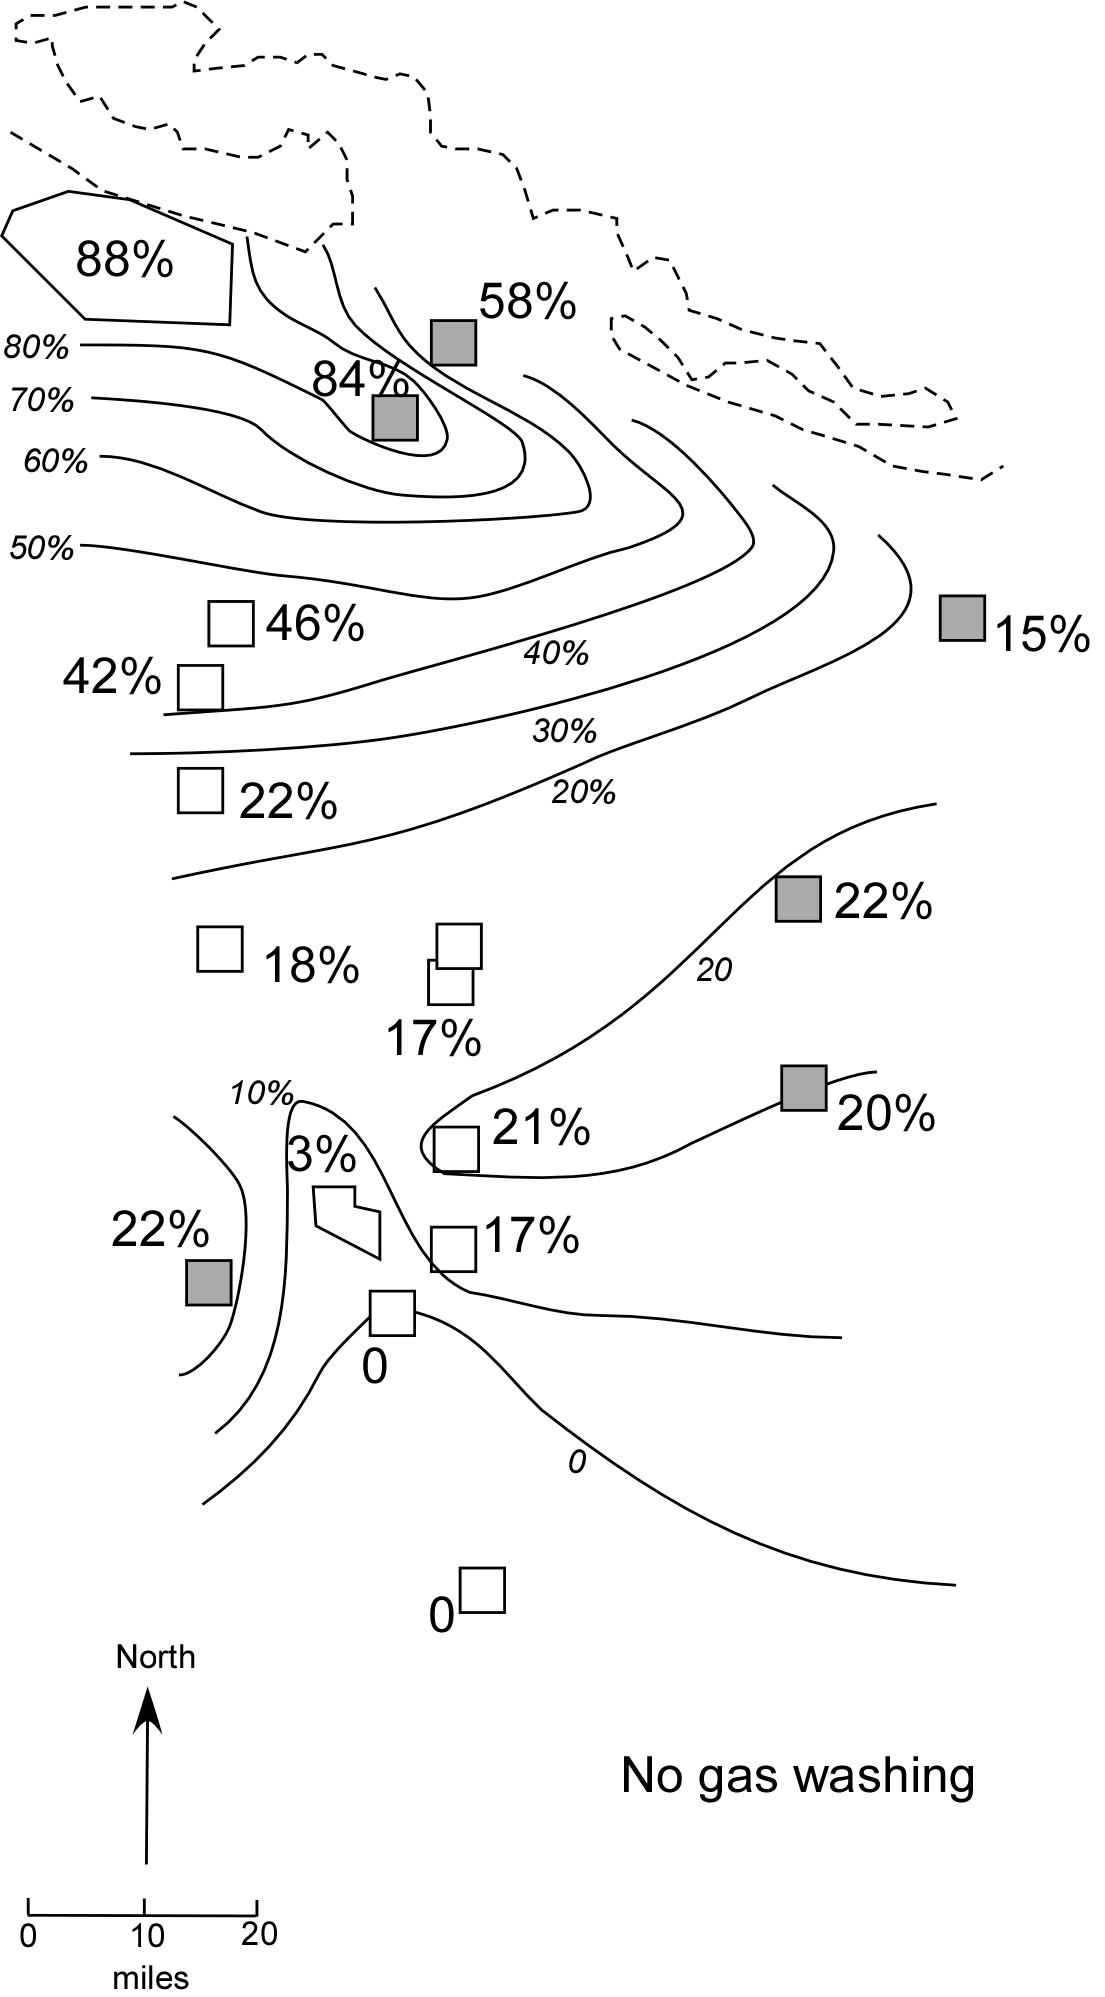
Figure 4. Percent n-alkane depletion (nC10+) in sampled oils due to gas washing, offshore Louisiana. White squares are sample locations reported previously; gray squares are locations of additional samples analyzed at MSU
In monetary terms, gas washing diminishes the value of oil by removing economically-valuable light compounds. Based on whole-oil compositional analysis from SARA and PIN analyses, combined with multi-component analysis of gas washing by petroleum compound type (Losh and Cathles, 2010 Mar. Petrol. Geol) and estimate of original oil composition from published sources, we estimated the dollar impact of gas washing of the oils in the sample set (Figure 5). Based on $60/barrel oil, gas washing has diminished the value of oil relative to its ‘unwashed’ precursor by as much as nearly 20% of its value, or $12/barrel. Gas washing is a significant risk in geologic settings where substantial amounts of mixing and separation of gas and oil take place during migration.
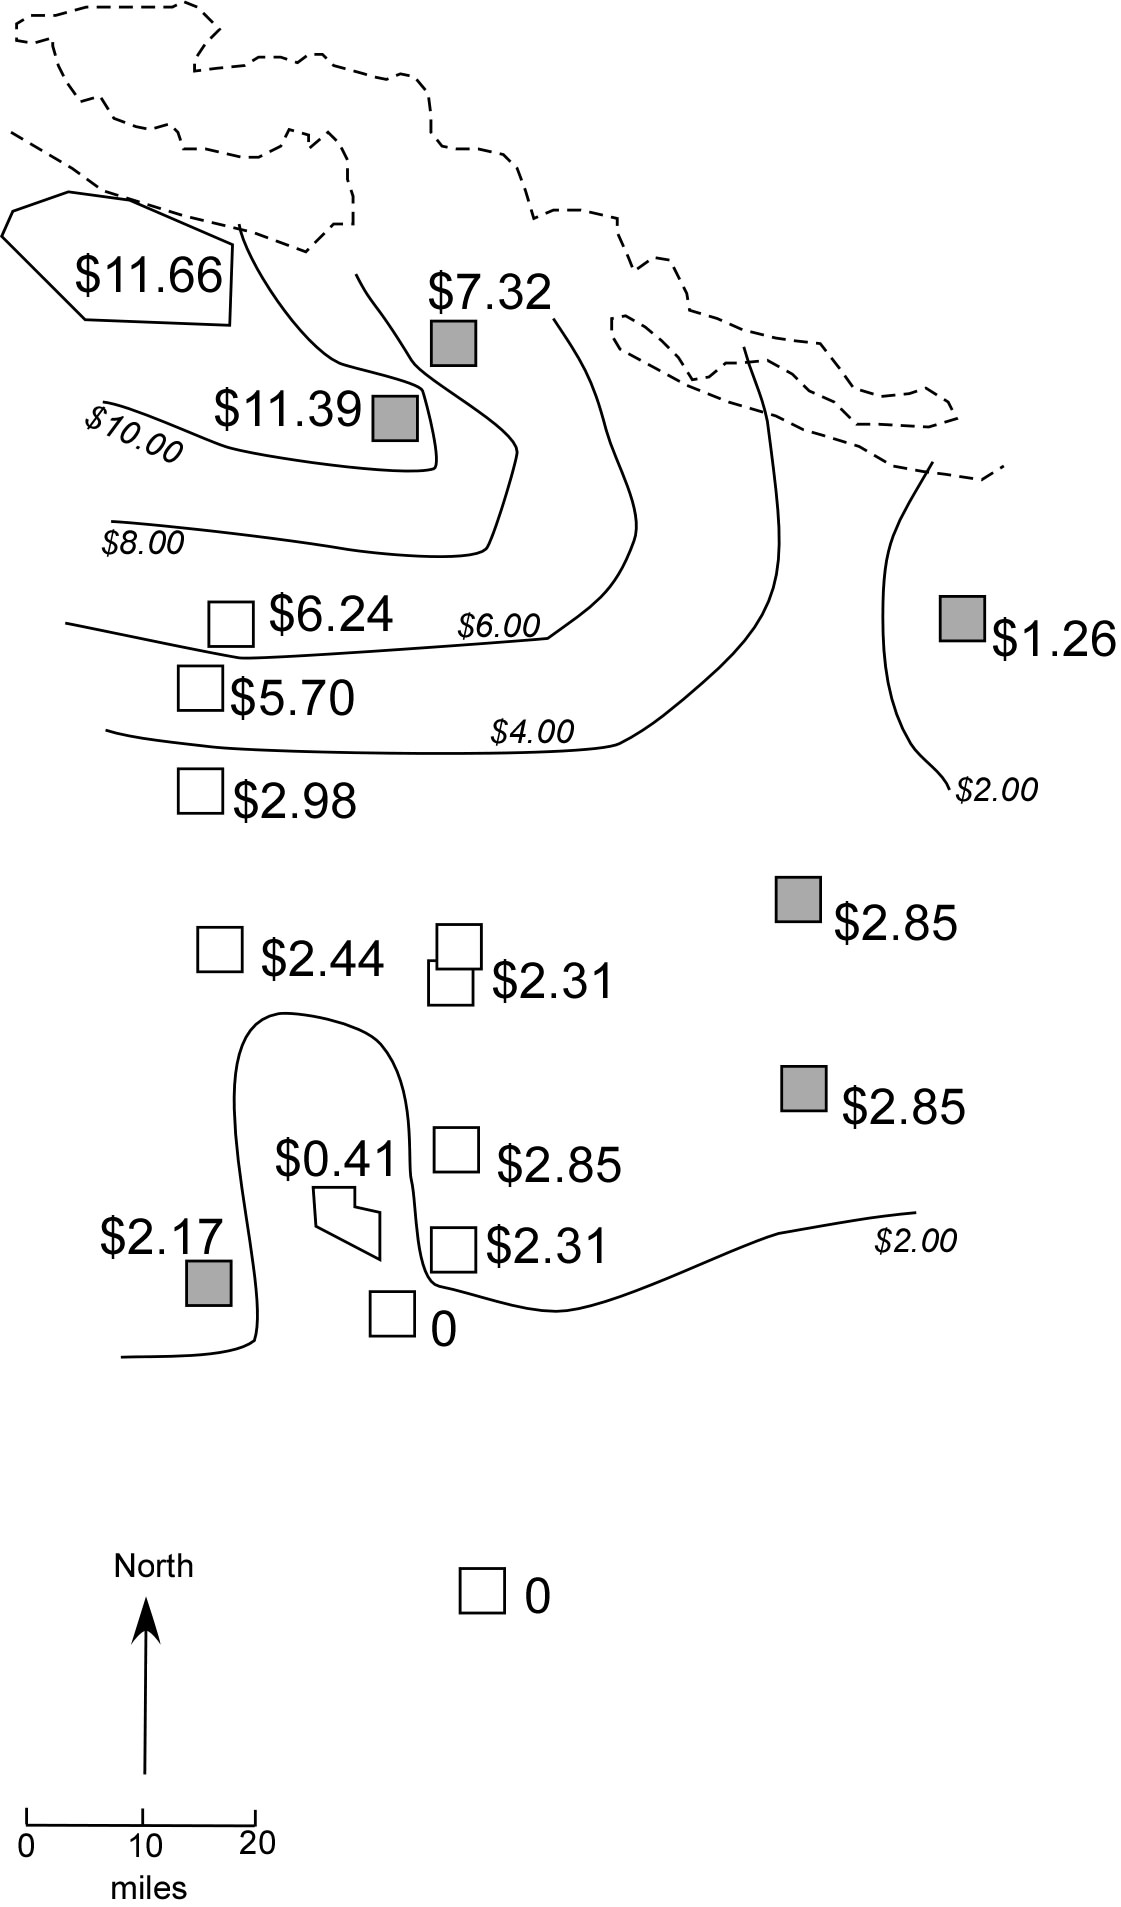
Figure 5. Dollar value lost from a $60 barrel of ‘unwashed’ oil by gas washing.
Regional trends
In our transect offshore Louisiana (see Figure 3), the maximum break number of gas-washed oil decreases with distance from the shoreline (Figure 6). This implies that the pressure (and correspondingly the depth) of gas washing decreases in the offshore direction.
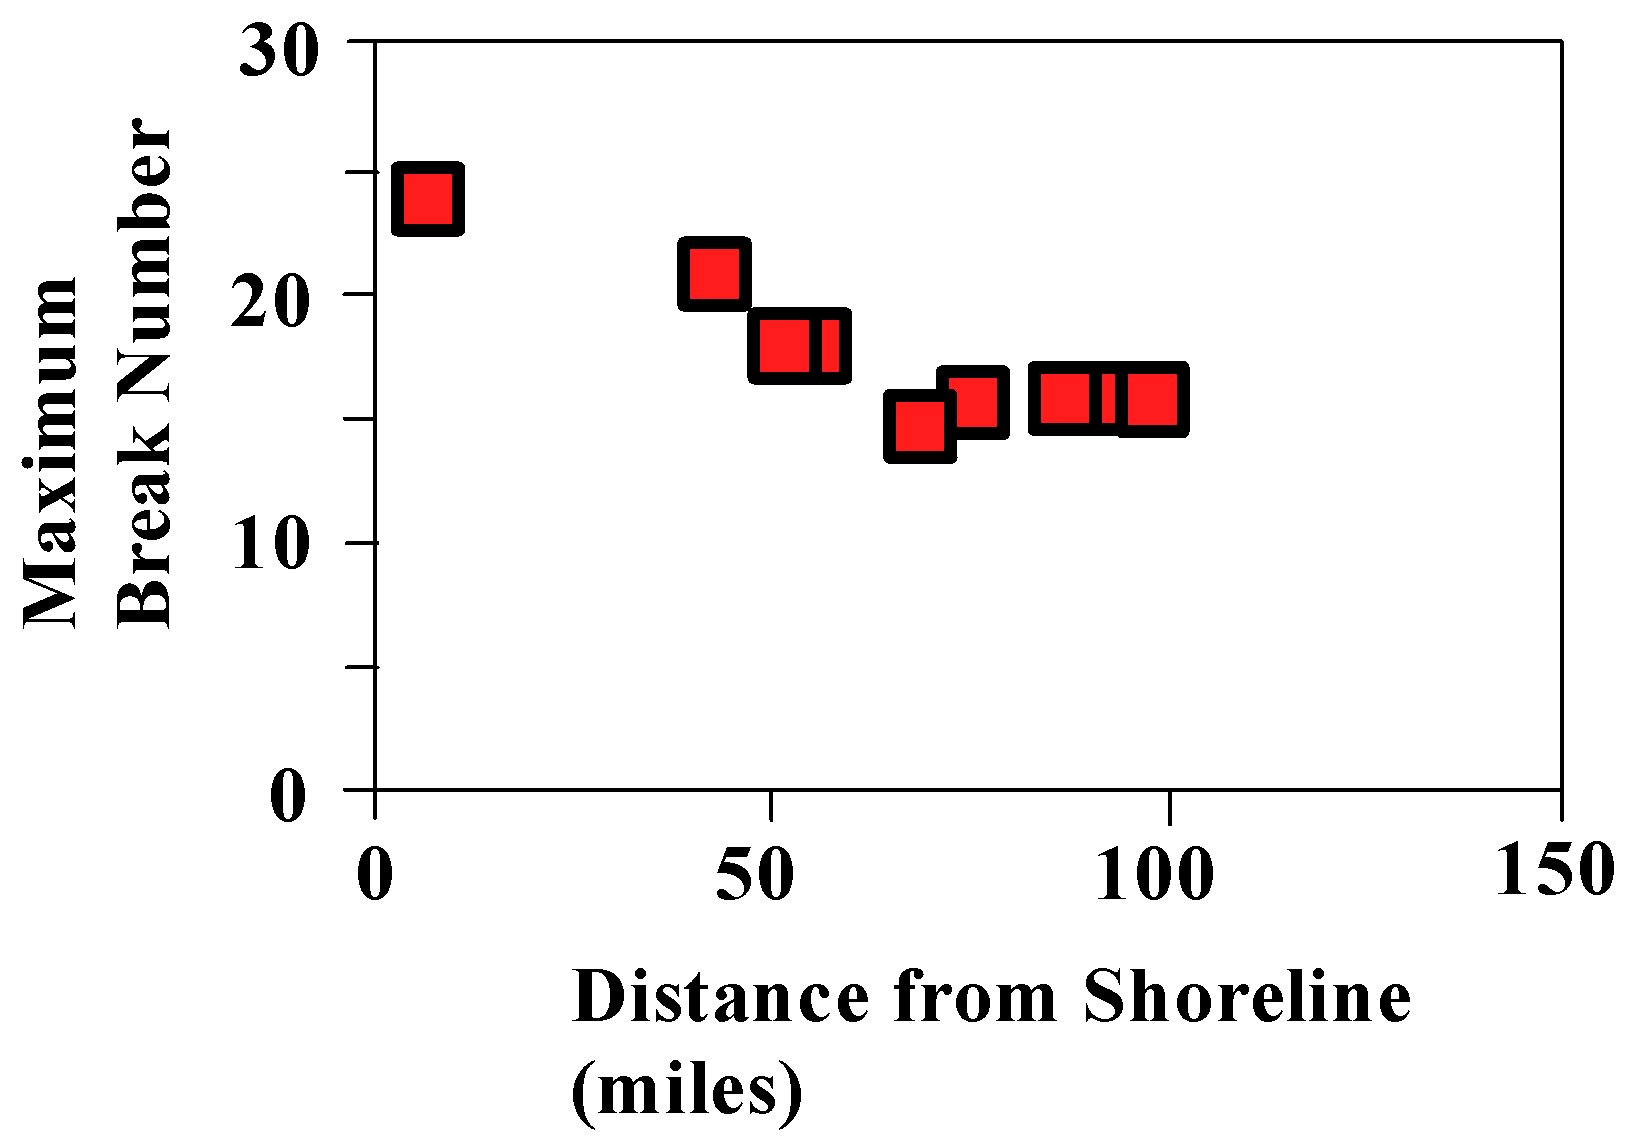
Figure 6. Maximum n-alkane “break number” versus distance from the shoreline. The break number, a proxy for depth of gas washing, decreases offshore. This is consistent with the decreasing depth of the base of the interbedded deltaic sand-shale section, further indicating that gas washing reflects the distribution of sand.
This trend, coupled with observations at Tiger Shoals and EOS modeling at SEI330, indicates that gas washing is largely controlled by the position of laterally-extensive “washing” sands along the migration pathway. Figure 7 schematically shows that gas washing takes place at sands that lie at the base of the shale-dominated deltaic/slope facies. The extent of gas washing is largely determined by the ratio of gas to oil in the migration pathway at the time of gas washing. Basin modeling indicates that mass GOR is significantly higher nearshore, where oils are more intensively gas-washed. The very existence of a deep sand in the migration pathway can be inverted from EOS modeling of oil compositional data, interpreted in the geologic context of the petroleum system that is operative in a given area.
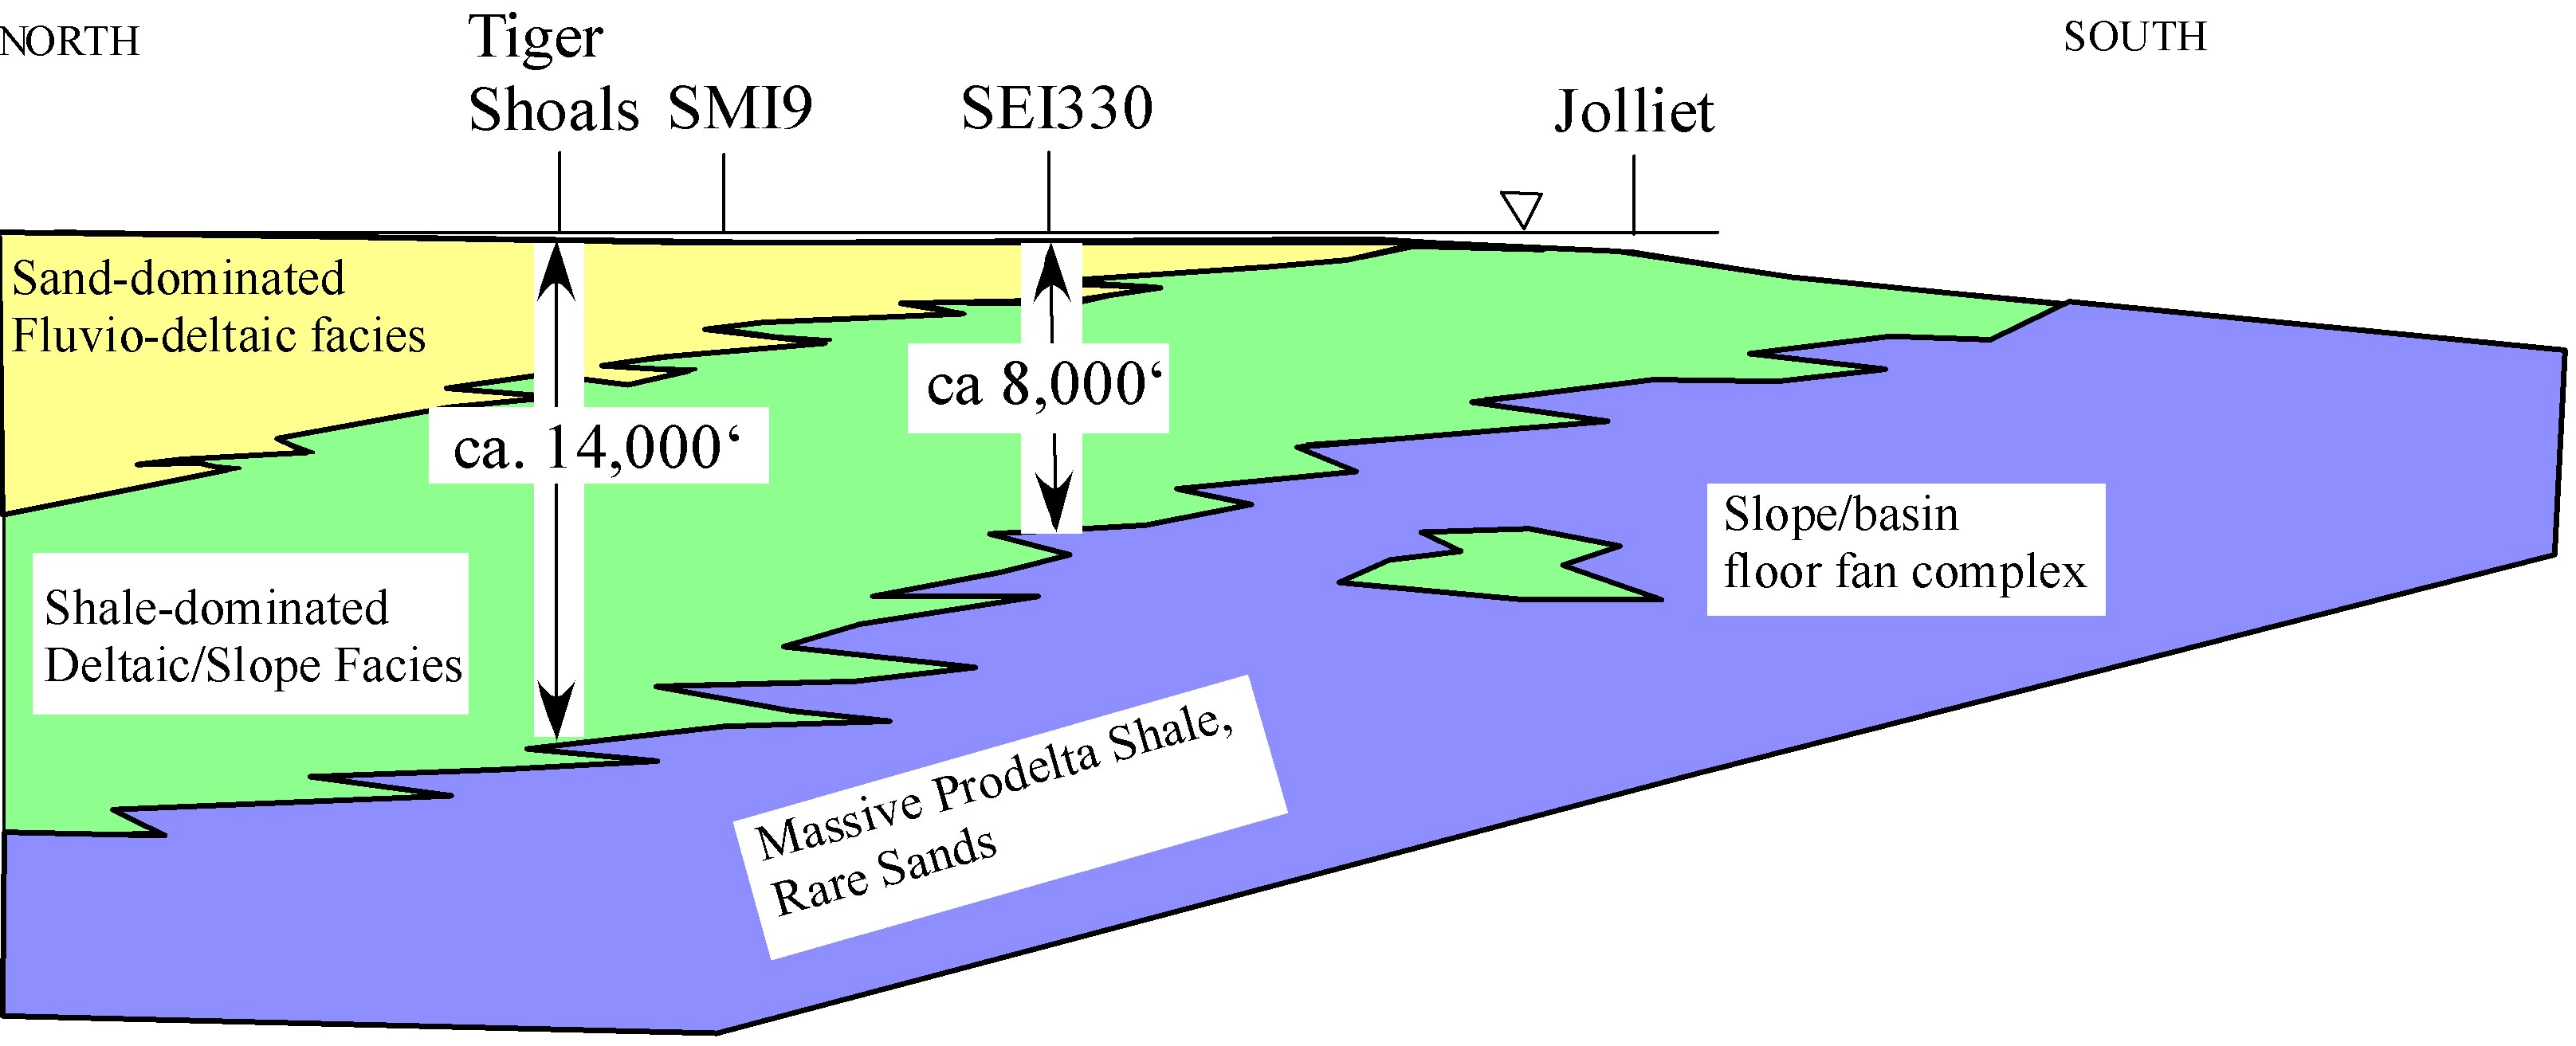
Figure 7. North – south schematic model for lithostratigraphic setting of gas washing. Present depth of sediment in which gas washing took place is shown at Tiger Shoals and SEI330. These depths correspond to the base of the deltaic sand-shale section. Gas washing appears to be controlled by the distribution of sand in the petroleum migration pathway, a conclusion corroborated by the detailed study at Tiger Shoals and the trend of decreasing break numbers, hence decreasing depth of gas washing, in the offshore direction.