
Losh, S., Cathles, L., 2010, Gas washing and oil-condensate mass balance at South Marsh Island Blocks 208-239, offshore Louisiana; Marine Petrol. Geol. v. 27, pp. 467-475
The Tiger Shoals (South Marsh Island Blocks 208-239) study area comprises six oil and gas fields (Figure 1), operated by ChevronTexaco. Together, they contained initial reserves of 136 million barrels of Eocene shale-sourced oil and 6.4 Tscf gas, which produced condensate. Production is from a stack of thirty faulted, nearly flat lying Miocene deltaic sands, generally shallower than 12,000 feet. In the Starfak field (Figure 1), the deep Rob L sand has produced about 7.2 MMbbl oil at a depth of about 15,000 feet. It has not been tested beneath the other fields in the study area. A question posed by explorationists for an initial study we undertook was: What is the likelihood of oil in the Rob L sand beneath the other fields?
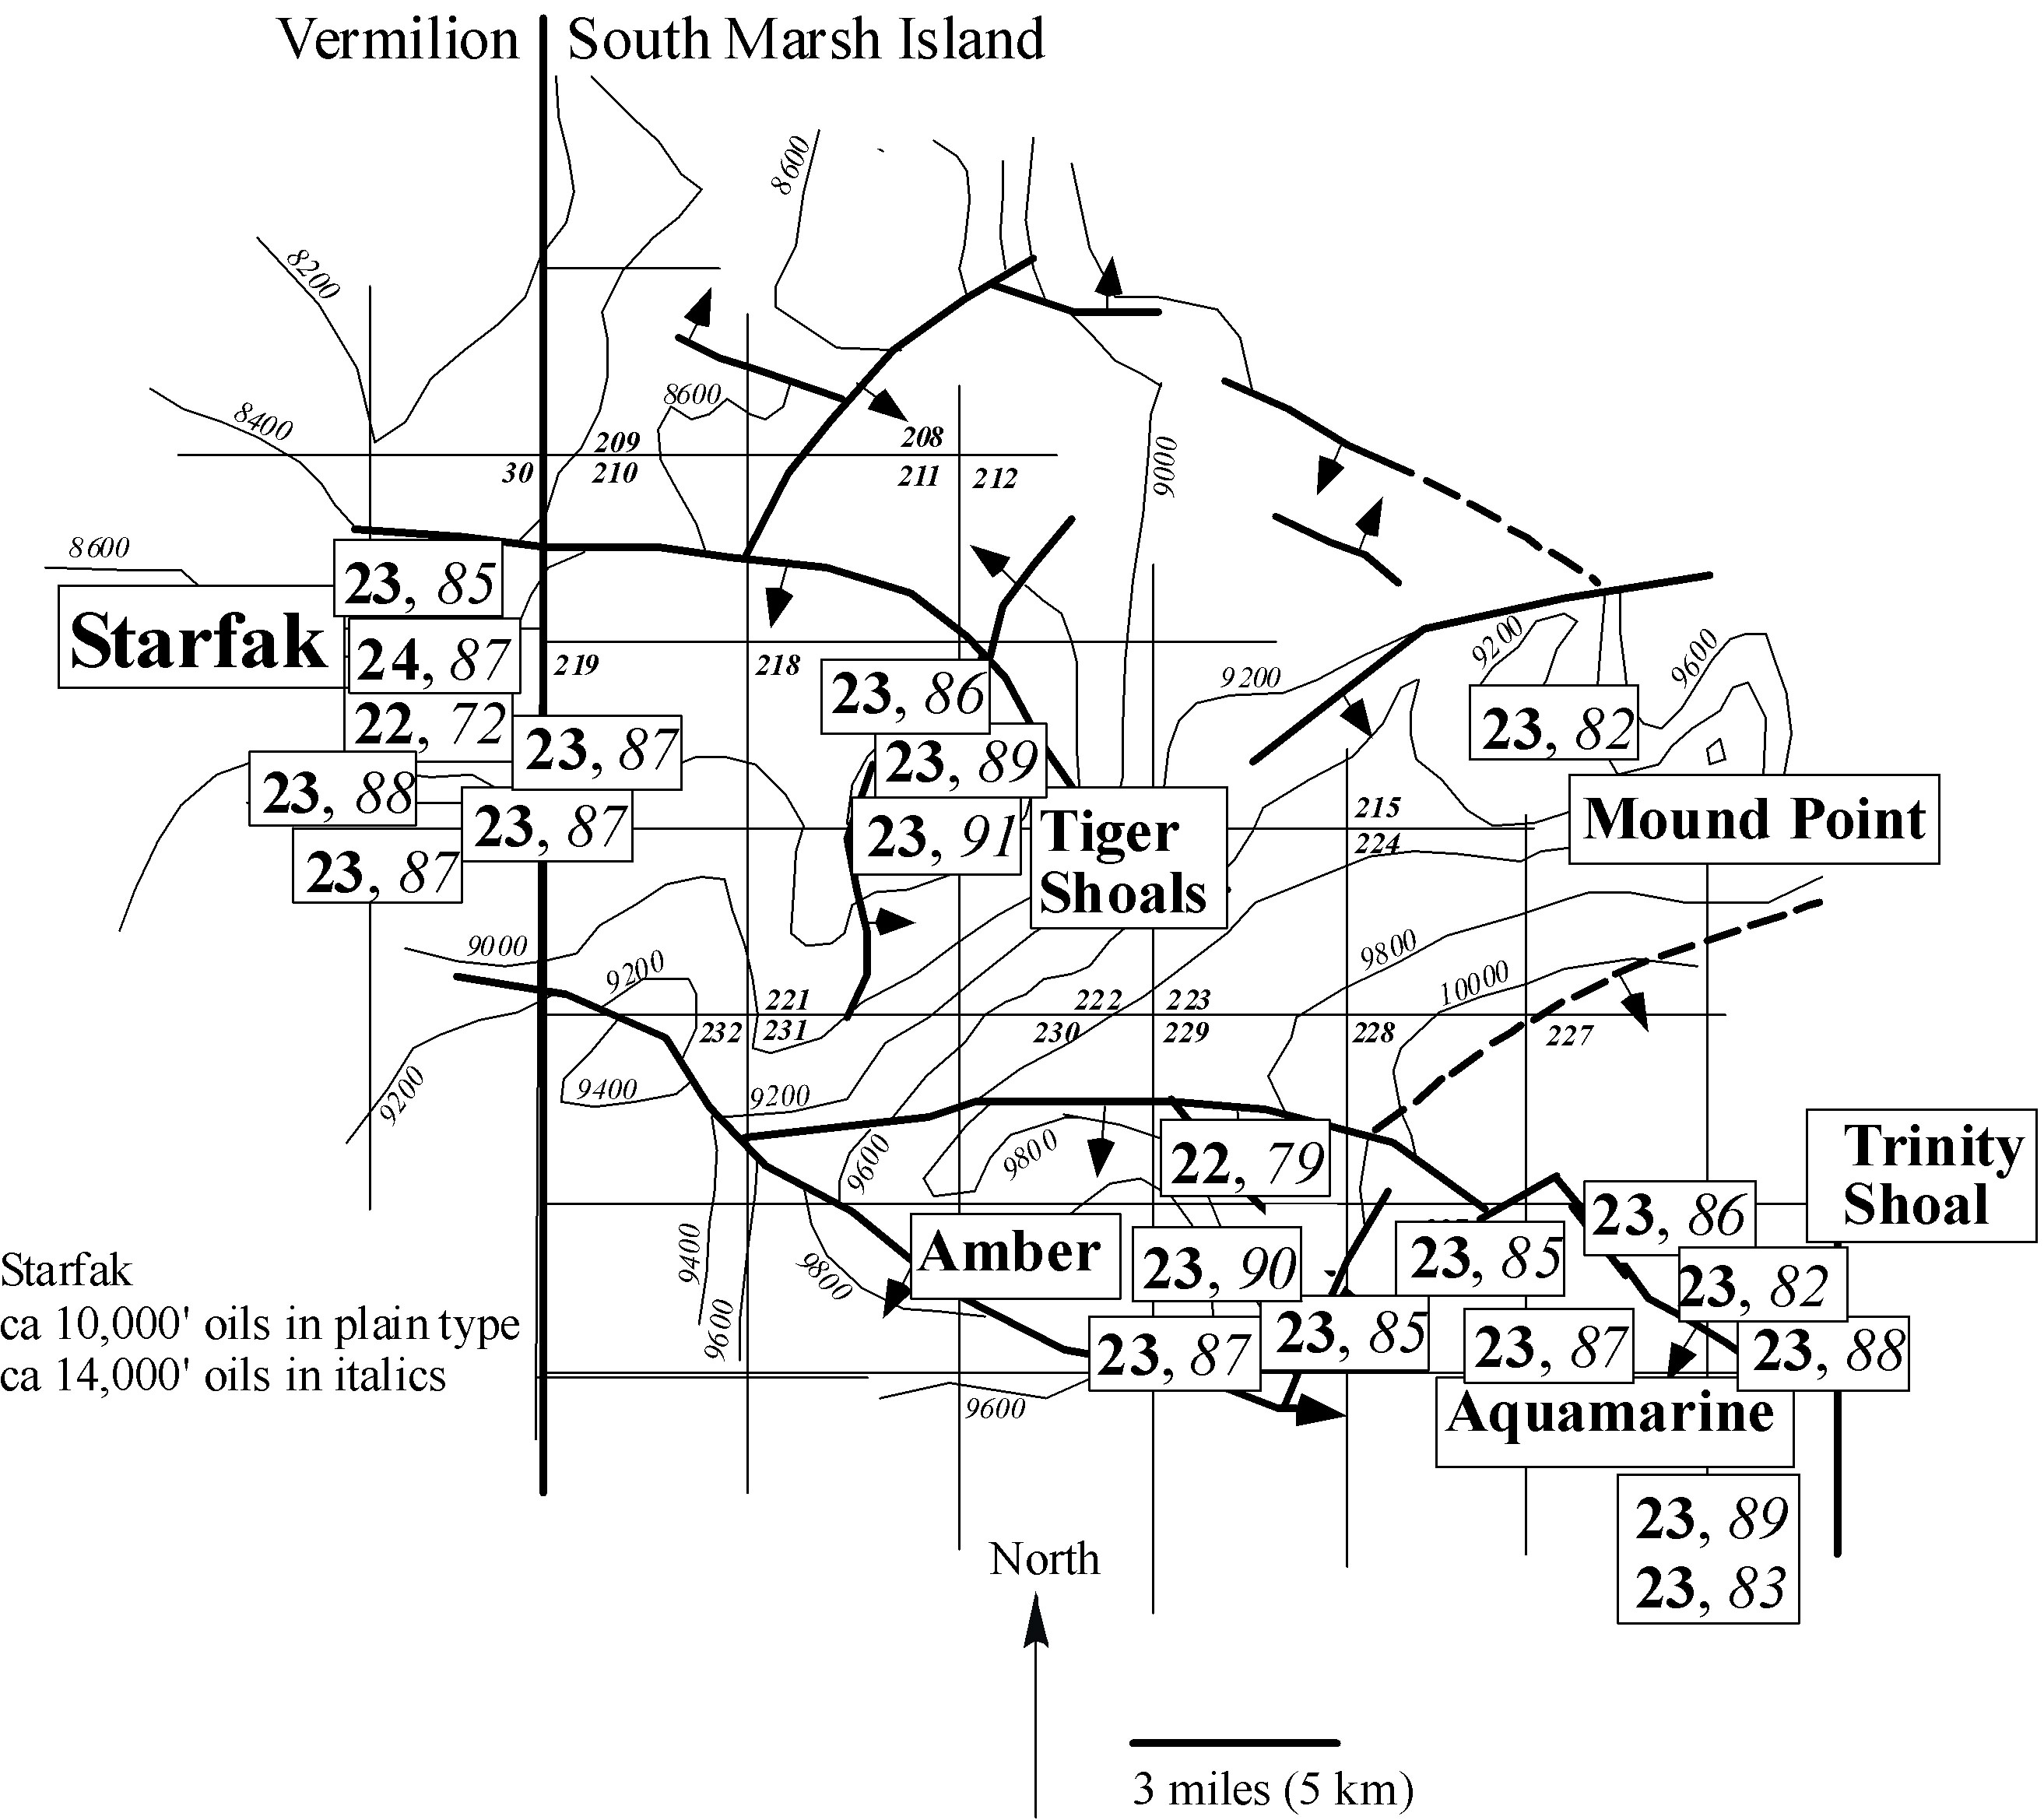
Figure 1. Structure contour map of Textularia L sand at Tiger Shoals. Boxes show “break number” (bold type; for explanation of ‘break number,’ see here) followed by weight percent depletion of C10+ n-alkane (italics) in gas-washed oil relative to unfractionated parent. Contours are in feet below sea level.
Tiger Shoals oils are remarkably uniformly gas-washed (Figure 1; for a description of gas washing, click here). Nearly all have the same ‘break number’ (23) and are depleted to nearly the same extent (86% +/- 4%). The uniformity of gas washing over a 30 x 40 km area strongly implies that phase mixing and fractionation took place in an extensive, relatively flat–lying sand, rather than in scattered vertical migration pathways.
Biomarker data (Losh and Cathles, 2003, Gas Research Inst. report) show the oils have similar source and maturity, and that each field was filled from the nearest fault. The narrow range of maturities implies that filling was probably a brief event.
Tiger Shoals oils are unbiodegraded, requiring the reservoirs to have been filled when they had already been buried to temperatures hotter than 70 C, the temperature at which oil biodegradation effectively ceases (see Losh et al., 2002, AAPG Bull.). Using the appropriate sedimentation rates, we compute that reservoir filling took place within the last ~4 million years.
Equation of state/phase equilibria modeling (Muelbroek et al., Org Geochem 1998) for Tiger Shoals oils (Fig. 2) shows that their n-alkane compositional profile resulted from gas washing (evaporation of oil n-alkanes into a mobile vapor phase) at about 10,000 psi and 120 C. Extent of n-alkane depletion was produced by interaction of oil with about 4 moles of ‘washing’ gas for each mole of oil.
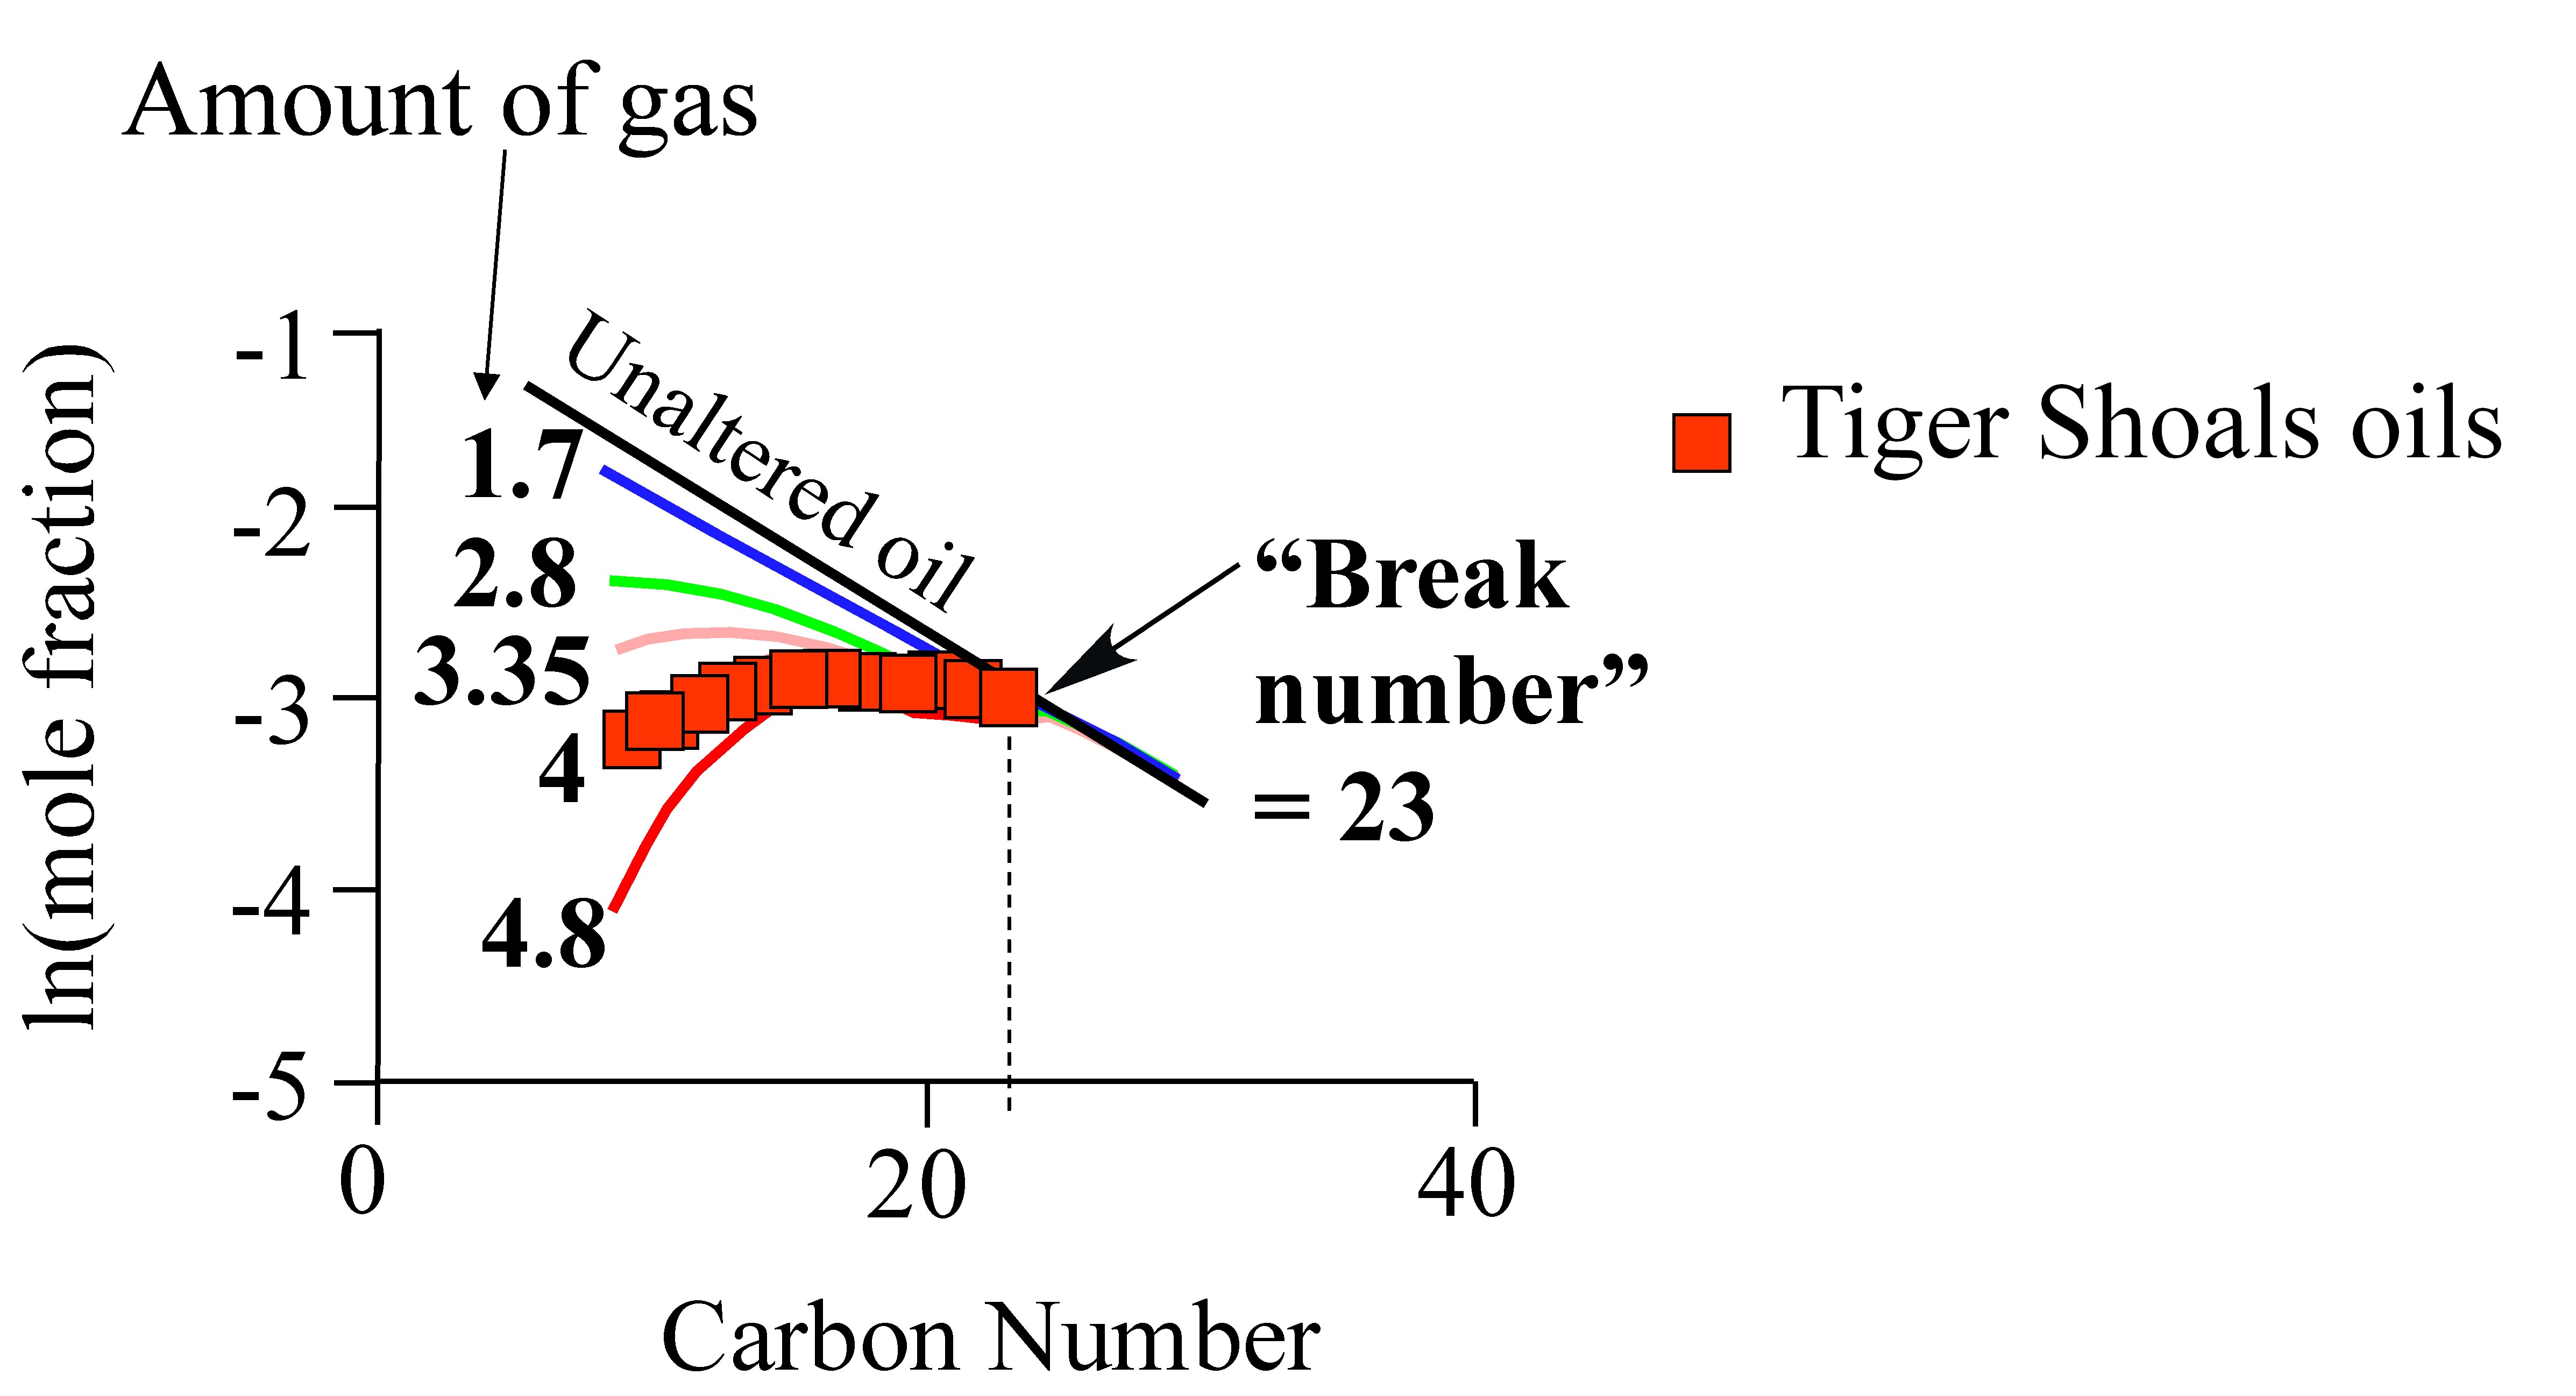
Figure 2. Gas washing EOS modeling for a typical Tiger Shoals oil, P = 9700 psi, T = 120 C. “Amount of gas” refers to the molar ratio of ‘washing gas’ to oil.
The gas condensate that separated from gas-washed oil is present at Tiger Shoals. This is demonstrated by the geochemical ‘fingerprints’ in both oil and condensate produced from the field (Figures 3, 4).
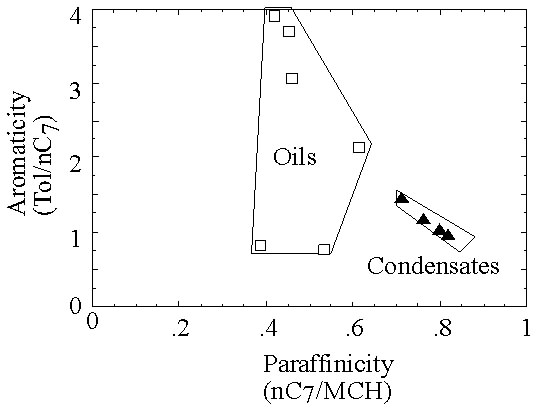
Figure 3. “Thompson plot” of aromaticity (Toluene/n-heptane) versus paraffinicity (n-heptane/methylcyclohexane) for Tiger Shoals oils and gas condensates. The two show a typical pairing, whereby the condensates show higher paraffinicity and the oils show higher aromaticity.
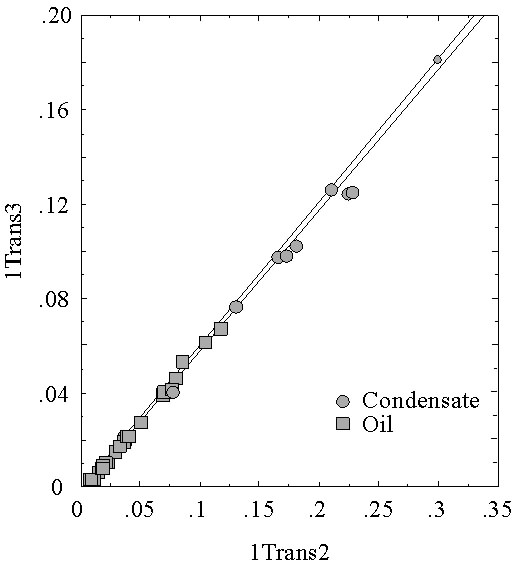
Figure 4. Dimethylcyclopentane (DMCP) isomer ratios for Tiger Shoals oils and gas condensates. Data show the two have essentially identical ‘fingerprints’ using these two isomers, indicative of similar sources; other geochemical indicators are consistent with this.
By using the computed fraction of n-alkane depletion (see here for more information), the depletions of all compound types – isoalkanes, naphthenes, aromatics, and asphaltenes – can be uniquely computed by mass balance. Tiger Shoals oils have lost up to 85% of their total C10+ mass to a vapor phase.
Reconstruction of fluid pressure history from porosity logs, using compaction disequilibrium principles (e.g., Gordon and Flemings, 1998, Basin Research; Revil and Cathles, 2001, GCSSEPM Proc.) indicates that the Rob L sand is the only sand at Tiger Shoals that could have had a pressure of 10,000 psi in the last 4 million years (Figures 5, 6), and thus is identified as the site of gas washing in the Tiger Shoals area.
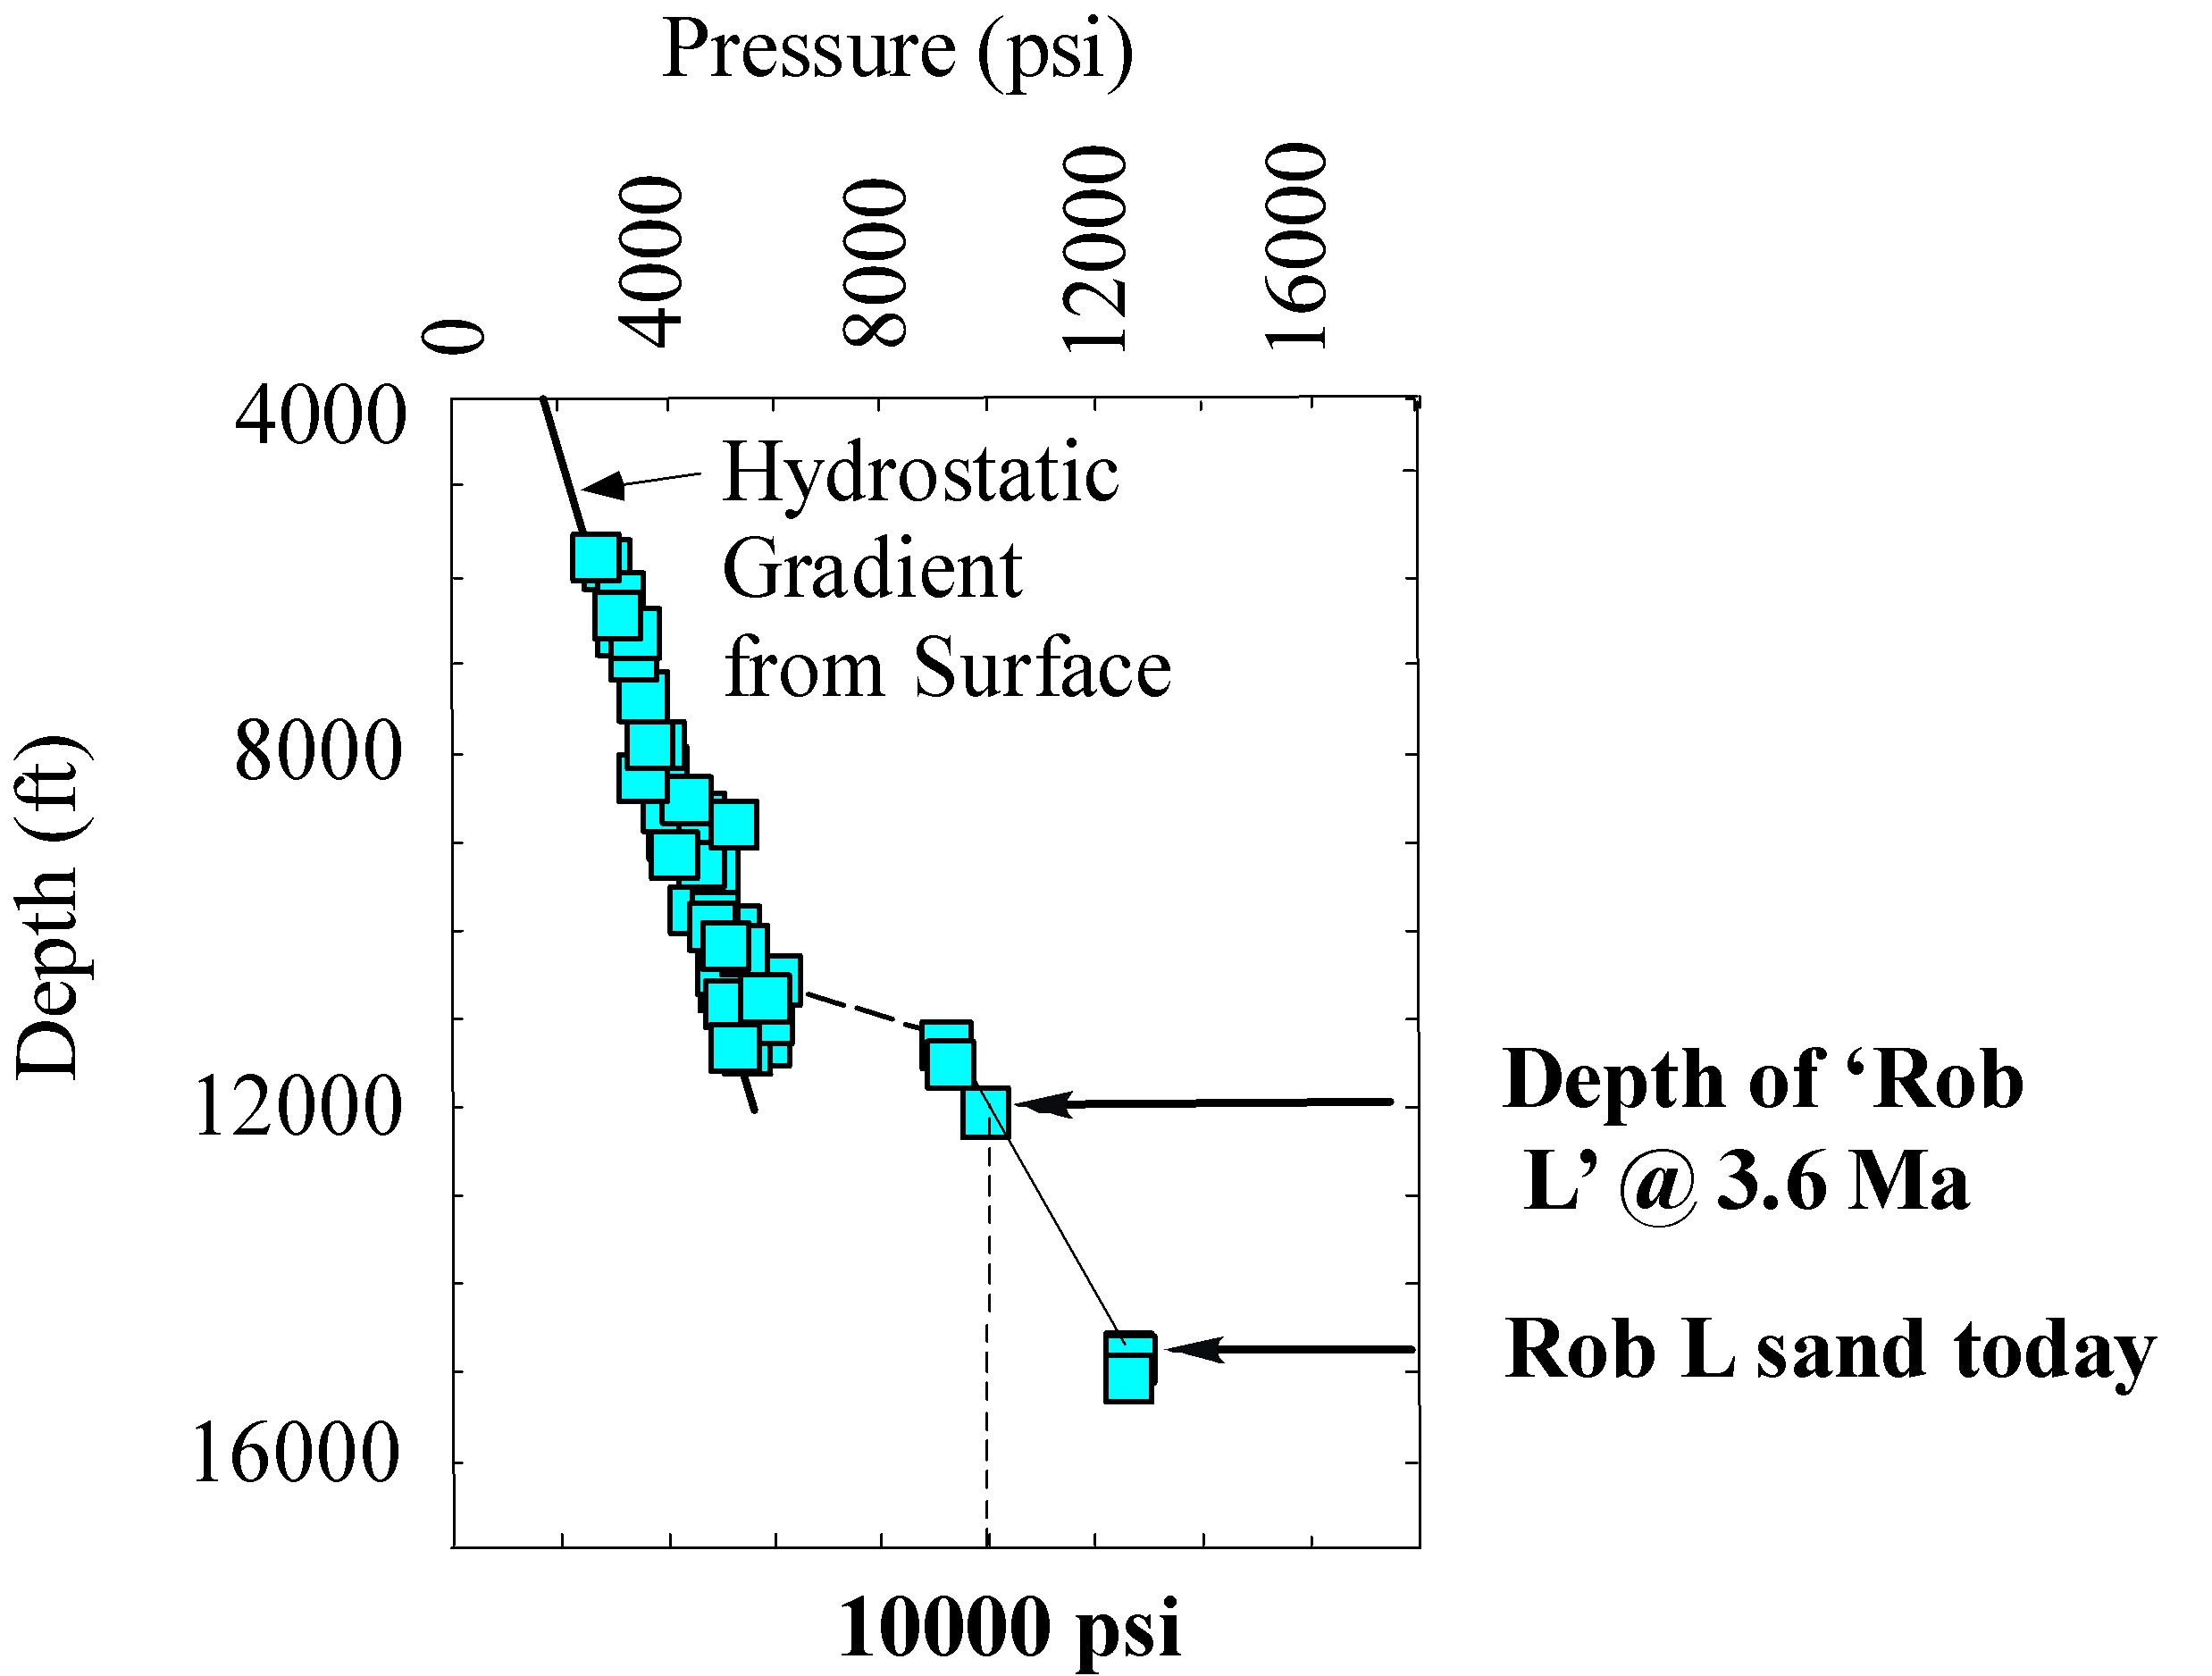
Figure 5. Static bottom-hole pressure measurements, Tiger Shoals study area. Porosity logs indicate that fluid pressure in the undercompacted Rob L sand has increased along a nearly lithostatic gradient for the past several million years. Past fluid pressure is back-calculated by backstripping along this gradient, to reveal that the Rob L sand was at a pressure of 10,000 psi at 3.6Ma. No other sand in the Tiger Shoals stratigraphic column fits these criteria.
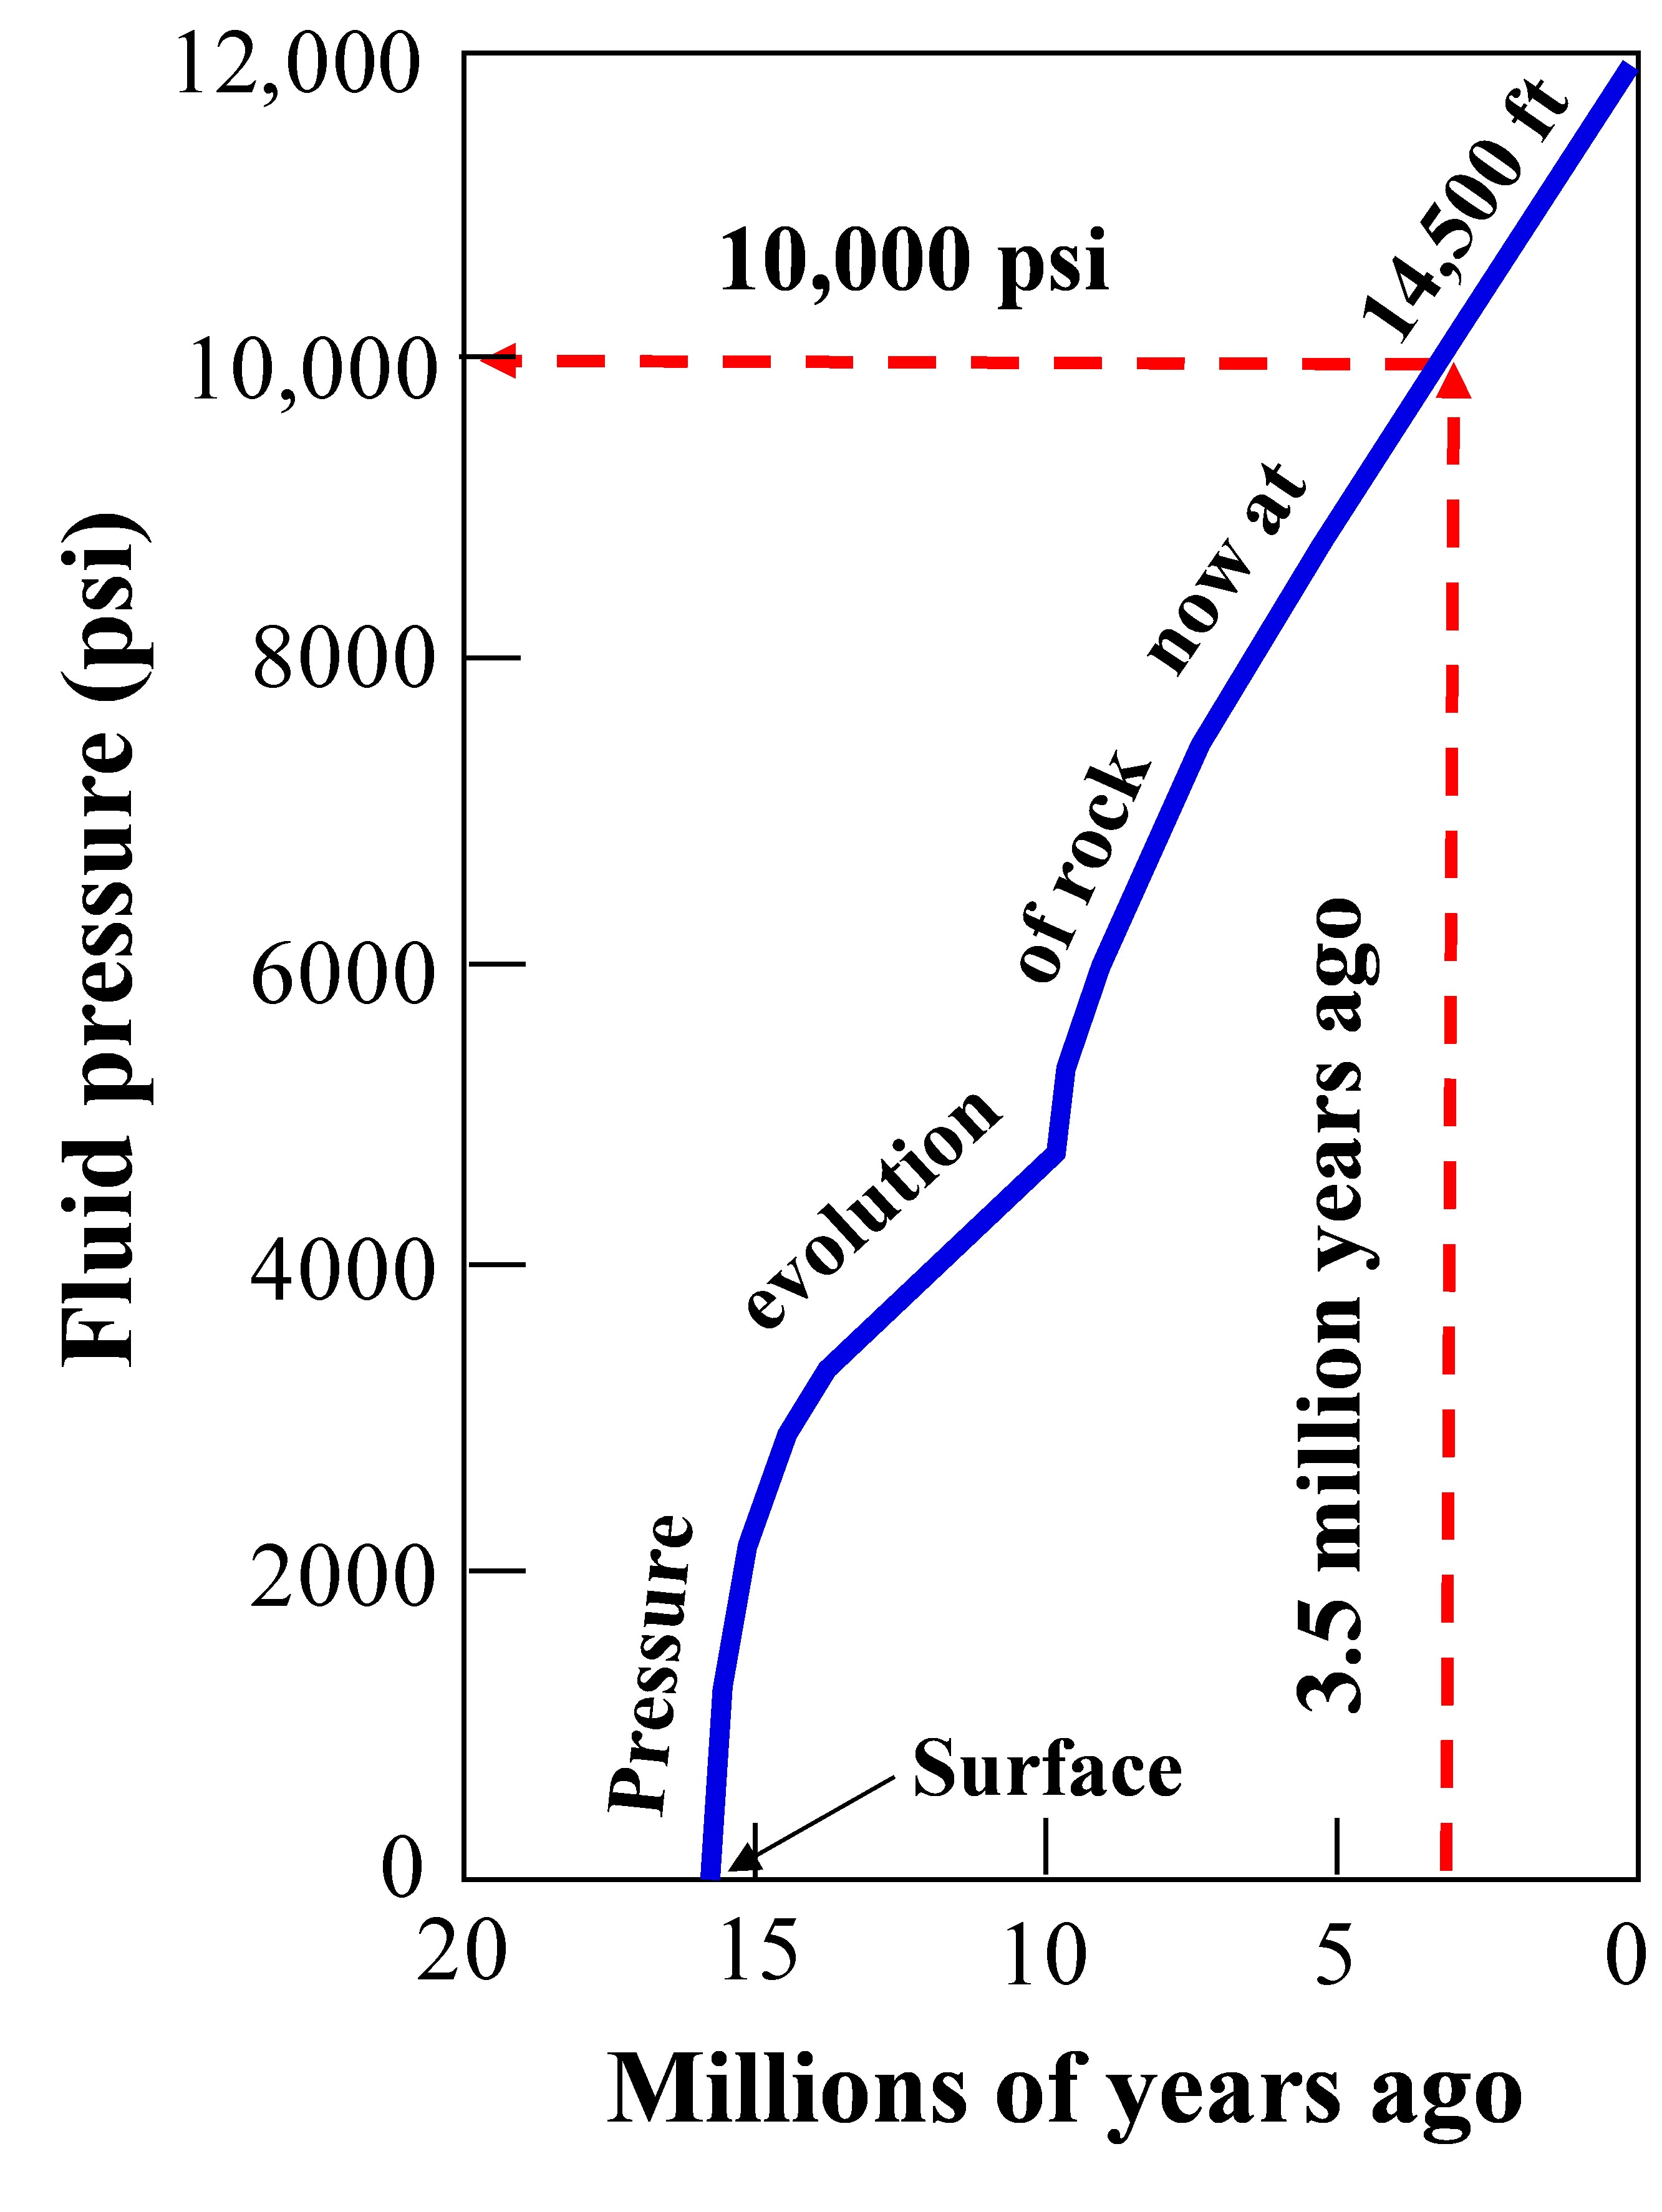
Figure 6. 1D BasinMOD compaction disequilibrium modeling of fluid pressure evolution based on well log lithologies, demonstrating that Rob L sand was at requisite pressure at the time of petroleum migration to be the site of gas washing, hence a potential reservoir where traps (such as faults or 4-way closure) exist.
If this scenario is correct, traps in the Rob L beneath other fields in the study area would clearly be highly prospective in a deep oil and gas exploration program. Figure 7 illustrates how we believe gas washing took place in the Rob L sand.
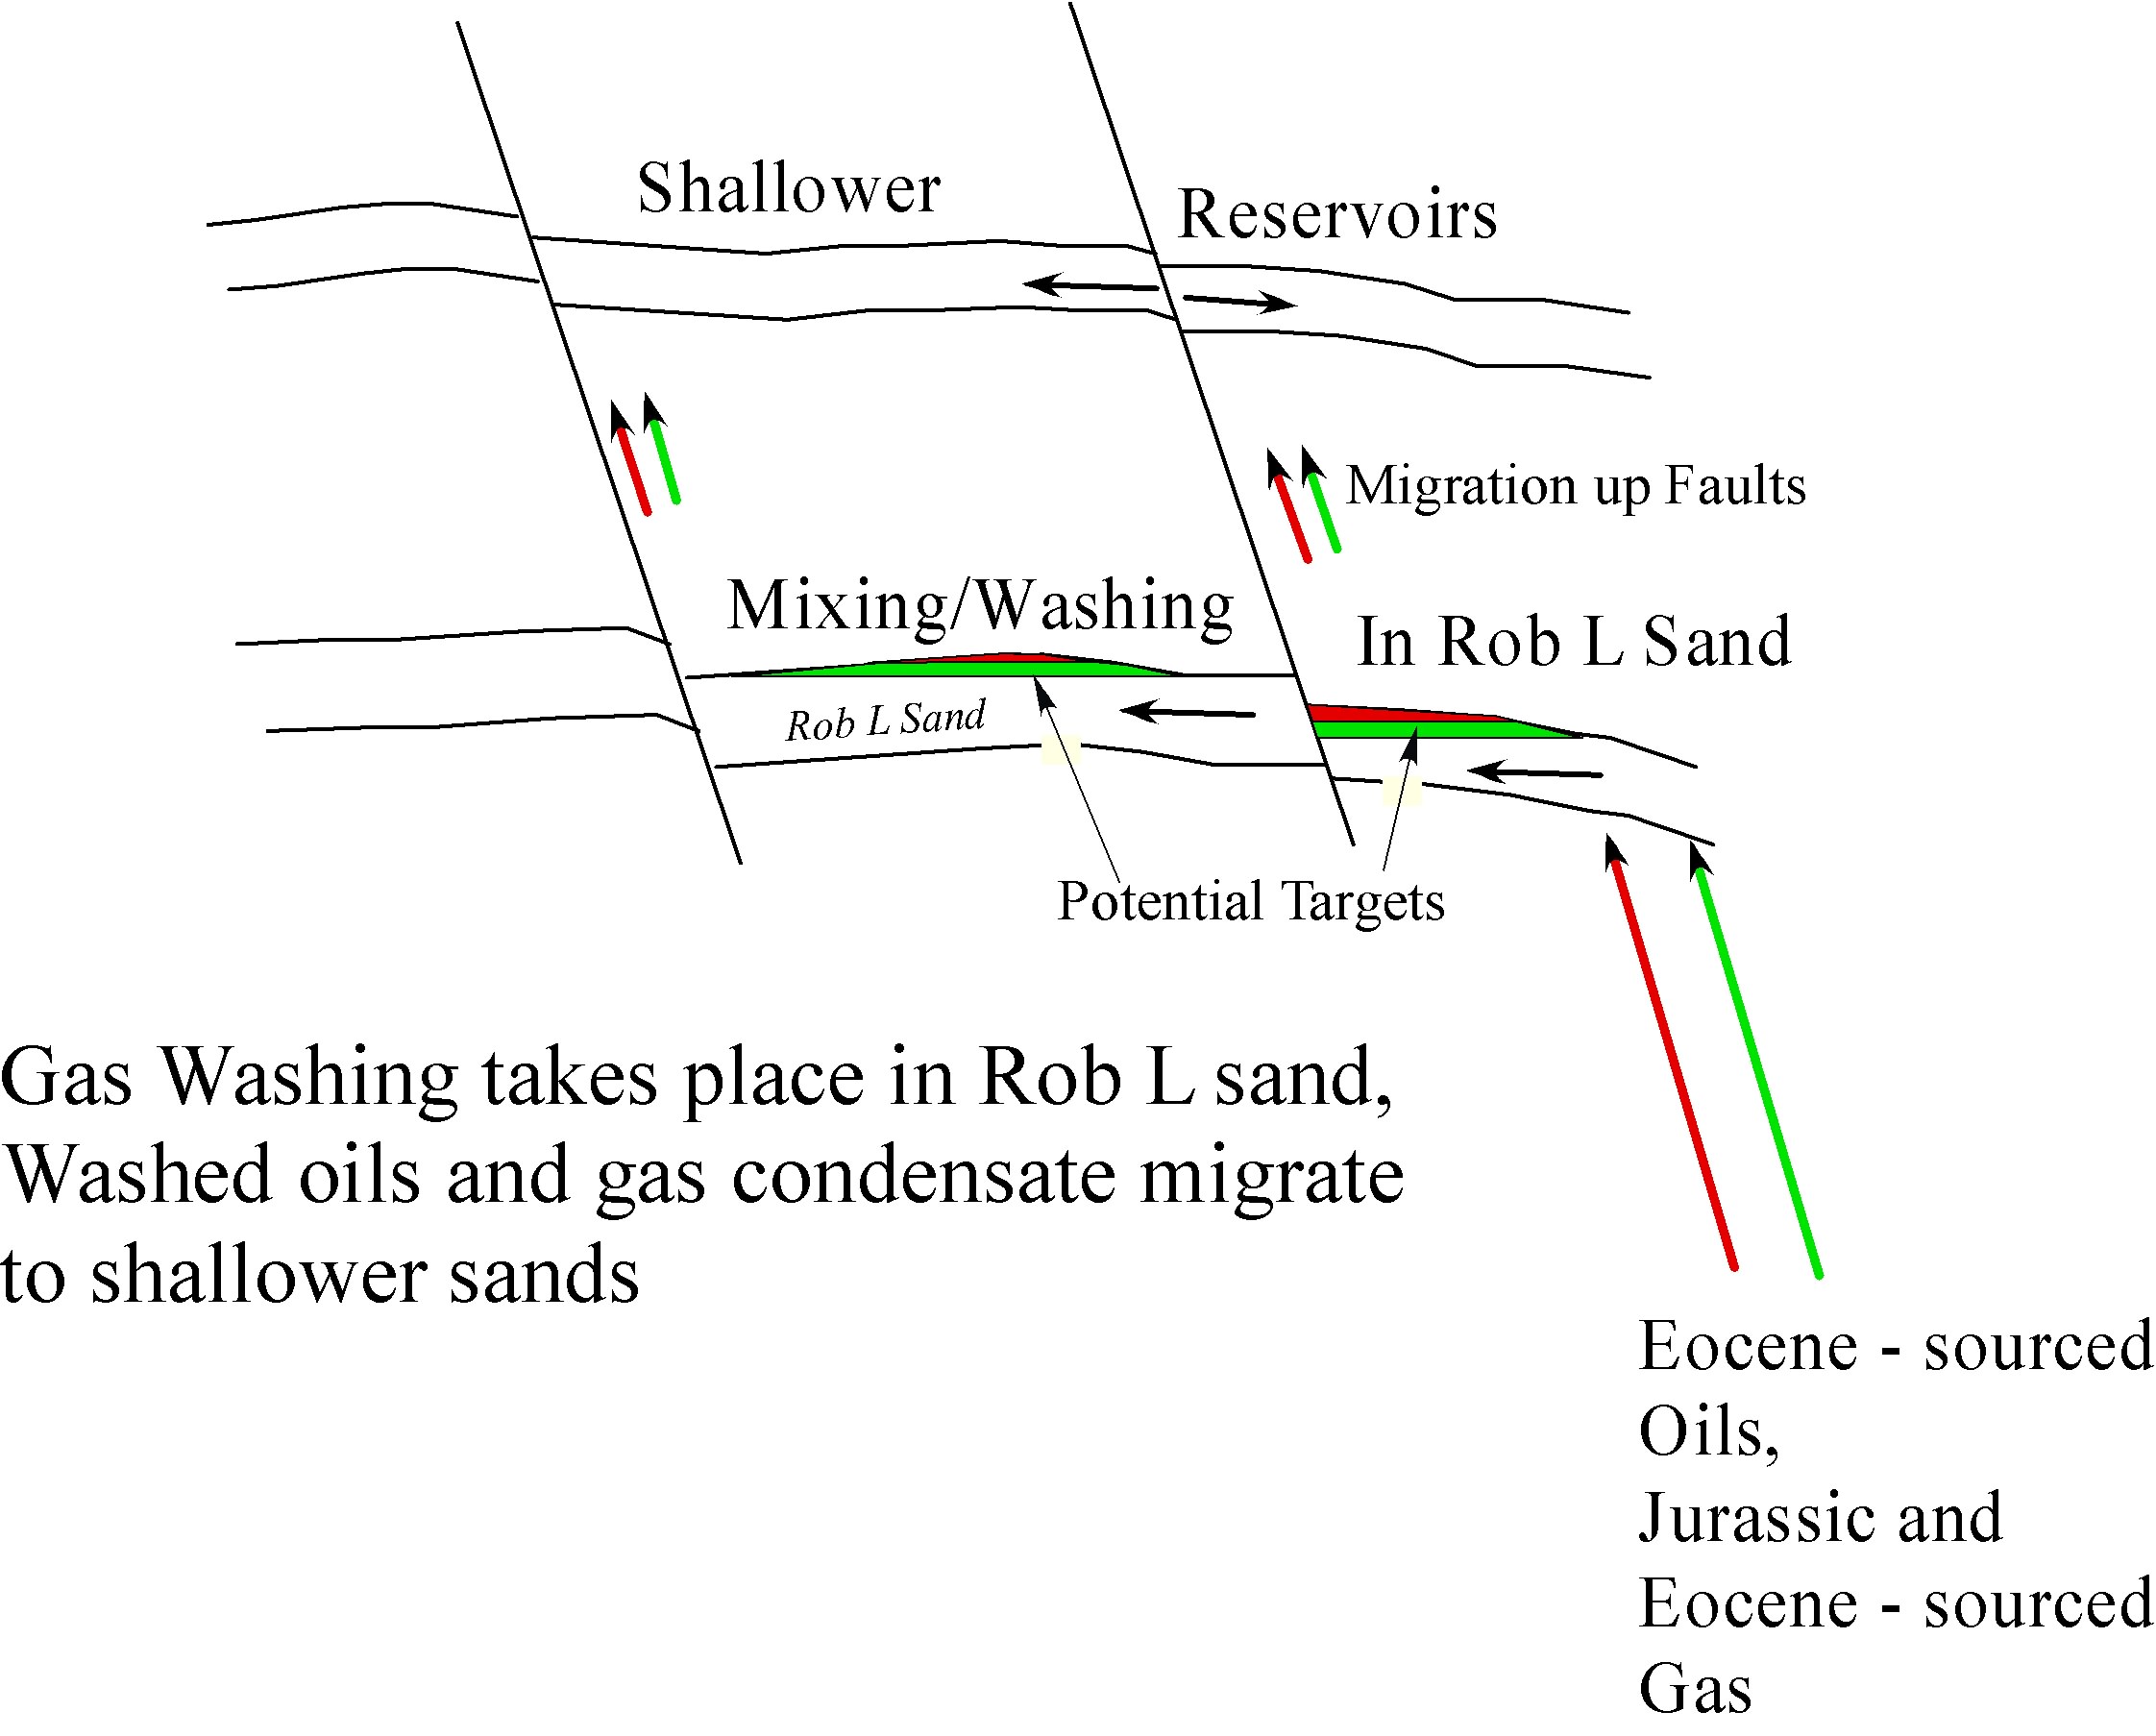
Figure 7. Schematic gas washing model of oil (green) and gas (red) at Tiger Shoals. Oil and gas ascend from source, mix, equilibrate, and separate in the Rob L sand, and then migrate up faults to shallower reservoirs. At 4 Ma, the Rob L sand lay at a depth of about 12,000 feet, and has since been buried an additional 2500 feet.